 Every year the Milliman Medical Index (MMI) examines the cost of healthcare for the typical American family of four under five separate categories of services:
- Inpatient facility care
- Outpatient facility care
- Professional services
- Pharmacy
- Other services
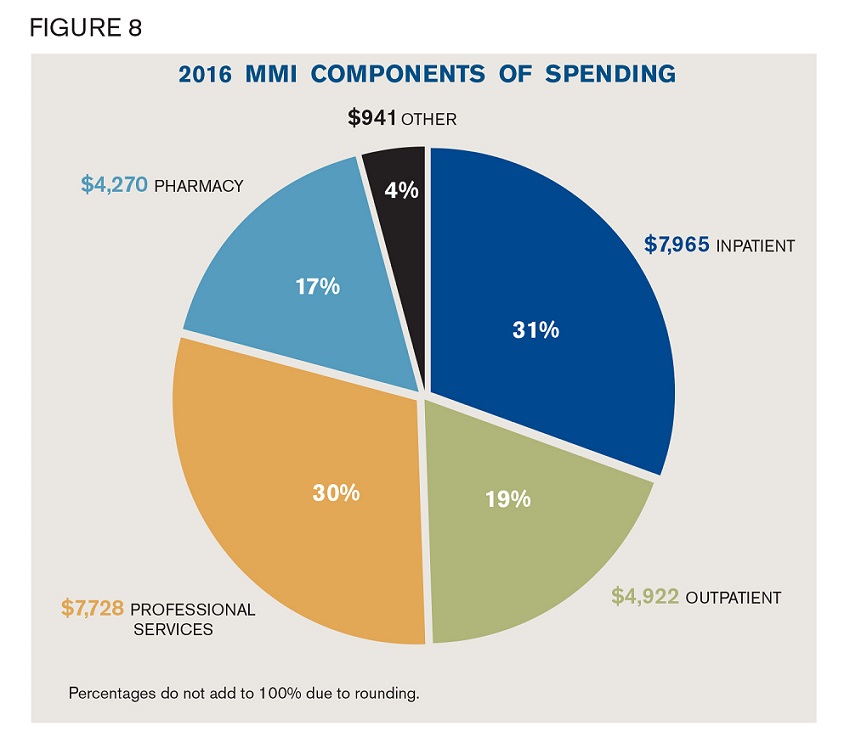
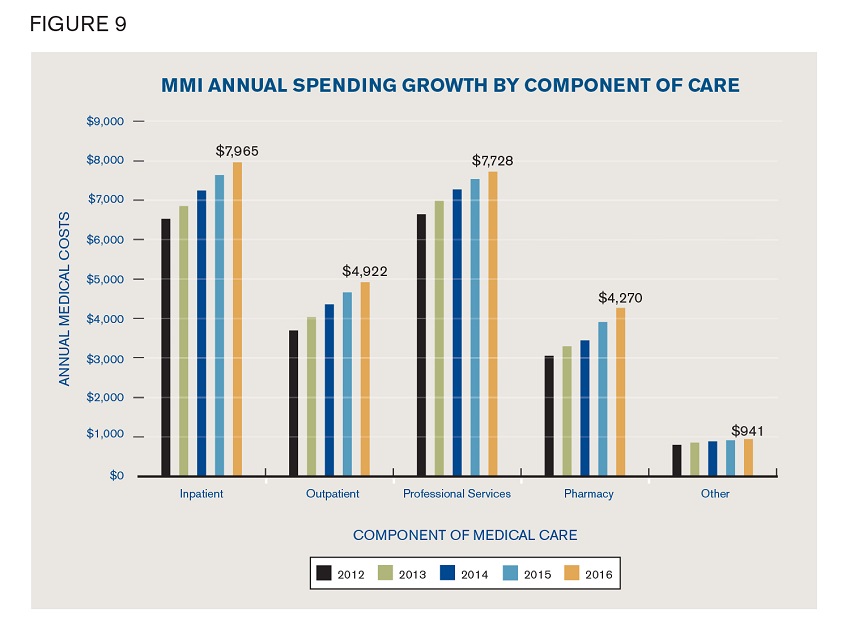
 As shown in Figure 8 in the study, for the MMI family of four, total facility care comprised 50% of total spending, with 31% being inpatient and 19% being outpatient. Another 30% of spending is for professional services, which includes services provided by doctors, physician assistants, nurse practitioners, chiropractors, hearing and speech therapists, physical therapists, and other clinicians. Pharmacy constitutes 17% of the healthcare spending pie, and the remaining 4% is for "Other" services, which includes miscellaneous other items and services such as durable medical equipment, prosthetics, medical supplies, ambulance, and home health. Figure 9 in the study shows how the dollar amounts of these components have been changing over time.
At $7,965 in 2016, inpatient facility costs grew by 4.2% (see Figure 10), the lowest annual increase in the past 15 years. Inpatient facility utilization changes continue to be very close to zero. Utilization is typically measured in terms of the number of inpatient days per year. That number of days results from a number of admissions, and the number of days each patient stays in the hospital. In recent years, admissions have declined, which sometimes increases average length of stay because it is the less intensive cases that tend to be avoided. The net result is that total inpatient days have changed very little. The admission reductions and length of stay increases may have resulted partly from hospitals' renewed emphasis on avoiding unnecessary readmissions, and partly by discharging patients at an optimal point in their care when they are healthy enough and logistics are in place such that they can recover and thrive without being in the hospital.

Outpatient facility spending also grew at a historically low rate, increasing by 5.5% to $4,922 in 2016. Part of the low growth rate may be attributable to pent-up demand and "crowd out," as people newly insured by the Patient Protection and Affordable Care Act (ACA)--especially in states that expanded Medicaid--consume limited hospital resources and produce treatment delays for other populations. Elective surgeries are one type of service subject to such delays resulting from capacity constraints.
The professional services slice of the healthcare spending pie has shrunk slightly, to 30% of the total in 2016. Professional services costs increased from 2015 to 2016, but at a lower rate than other services. The slow growth is primarily due to relatively low increases in physician payment rates for a given basket of services. When a physician treats patients having employer group insurance, like the MMI family of four, the physician usually gets paid according to a fee schedule that has been negotiated between the health plan and the physician. Today, those fee schedules are often based on the fee schedule Medicare uses. Over the past 10 years or more, that Medicare fee schedule has increased only at very low rates, at or near 0% in many years. Consequently, physicians often receive little or no payment rate increases for their Medicare patients, and also for their patients who have employer group insurance.
Prescription drugs costs are still the fastest-growing slice of the healthcare cost pie, increasing to $4,270, or 17% of the total, in 2016. Drug spending increased by 9.1% from 2015 to 2016, down from the previous year's increase of 13.6%. Although the lower rate of increase was encouraging, it is still much higher than the 3.8% growth rate for all other healthcare costs. Much of the prescription drug cost growth is driven by specialty drugs. While there is no universally accepted definition of specialty drugs, they are generally very high-cost drugs. Medicare defines specialty drugs as those costing more than $600 per script in 2016. For the MMI family of four, specialty drugs now constitute nearly 6% of all healthcare spending, which is approximately $1,550 for the family in 2016.
This content first appeared in the 2016 Milliman Medical Index.