Milliman’s midyear 2026 Multiemployer Pension Funding Study is an interim update to our annual study published in the first quarter of the year. This study updates the estimated funding status of U.S. multiemployer defined benefit (DB) pension plans as of June 30, 2026, showing the change in funding levels from December 31, 2025.
Key findings
- The aggregate market value funded percentage for multiemployer pension plans is estimated to be 106% as of June 30, 2026, up from 103% at the end of 2025.
- The aggregate funded position of plans continues to improve due to favorable investment experience and contributions made in excess of plan costs.
- The estimated investment return for our simplified portfolio for the first six months of 2026 was about 5.6%.1
- As of June 30, 2026, 161 plans have received nearly $78 billion in special financial assistance (SFA) under the American Rescue Plan Act of 2021 (ARP), which added 9% to the aggregate funded percentage since the SFA program’s inception.2
Current multiemployer pension funded percentage
Figure 1 shows that the aggregate funding surplus rose by about $27 billion during the six-month period ending June 30, 2026, to about $55 billion. The aggregate funded percentage increased from 103% to 106%. This is the highest funded percentage in the history of this study, which started in 2007.
Figure 1: Aggregate funded percentage (in $ billions)
| 12/31/2025 | 6/30/2026 | CHANGE | |
|---|---|---|---|
| Accrued benefit liability | $842 | $852 | $10 |
| Market value of assets | (870) | (907) | (37) |
| Shortfall/( |
$(28) | $(55) | $(27) |
| Funded percentage | 103% | 106% | 3% |
Based on plans with complete IRS Form 5500 filings. Includes 1,180 plans as of December 31, 2025, and 1,176 plans as of June 30, 2026.
The amounts in Figure 1 reflect nearly $78 billion of SFA paid as of June 30, 2026, to 161 plans in accordance with ARP and as administered by the Pension Benefit Guaranty Corporation (PBGC), including $3 billion paid so far in 2026. Without the SFA program, the aggregate funded percentage would be approximately 97%.
The liabilities in Figure 1 are projected using discount rates equal to each plan’s actuarial assumed rate of return on assets, which generally fall between 6% and 8%. The weighted average assumption for all plans is holding steady at about 6.8%, unchanged since the end of 2024.
The assets in Figure 1 are based on each plan’s most recently reported market value of assets, projected forward, assuming asset returns observed for a diversified portfolio typical for a U.S. multiemployer pension plan. Our simplified portfolio earned about 5.6% in the first six months of 2026.
Historical multiemployer pension funded percentage
Figure 2 shows the historical funded percentage of all multiemployer plans since the end of 2007 by the zone status on the latest Form 5500 used for the study. For example, the green line shows the historical funded percentages of plans currently in the green zone without regard to their previous zone statuses. The gray line represents plans that received SFA by June 30, 2026. The blue dotted line represents all plans combined.
Figure 2: Aggregate historical funded percentage, by current zone status and SFA
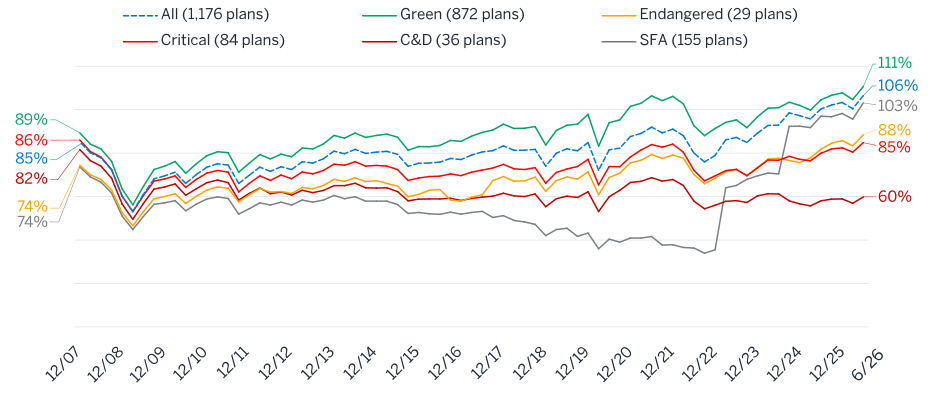
In the aggregate, the current funded percentage remains above 100%. There are 872 plans (74% of all plans) in the green zone, which have reached an aggregate funded percentage of about 111%. The plans that are not in critical or critical and declining (C&D) status are better funded in the aggregate than they were before the 2008 global financial crisis and continue to weather the ups and downs of the market.
Many plans have improved over the course of the study due to contributions in excess of plan costs. For example, in the last year of available data, reported contributions for all plans were $37 billion, and annual costs and administrative expenses totaled $25 billion.
As expected, plans that have received SFA have seen their funding status improve substantially. As of the date of this study, some plans that are eligible for SFA have not yet applied or received it. Their figures will be updated in future studies.
SFA for multiemployer pensions continues to wind down
SFA has made a significant difference for the most financially distressed plans in recent years. To date, 161 plans have received nearly $78 billion in SFA—almost the entire $79 billion that PBGC projects for the program. SFA is expected to be paid to plans through 2026 and possibly into 2027.
A key unanswered question is whether terminated plans will receive SFA. PBGC has interpreted the SFA program as limited to ongoing plans that satisfied the eligibility criteria. However, the U.S. Court of Appeals for the Second Circuit ruled that “a plan terminated by mass withdrawal before 2020 is not per se ineligible to receive SFA.”3 The Supreme Court declined to review that decision, leaving unresolved if or how many of these terminated plans could ultimately apply for and receive SFA. Ninety-two plans that terminated due to mass withdrawal prior to the 2020 plan year have submitted an initial application by the statutory SFA application deadline of December 31, 2025. The conclusion to this issue is uncertain at this time.
Because terminated plans do not file actuarial information on IRS Form 5500, this study will continue to only report on ongoing plans.
What lies ahead?
Although achieving the strongest funded position to date represents a significant milestone, it does not eliminate the need for continued vigilance. Pension plans still face a multitude of material risks, particularly those stemming from economic uncertainty, market volatility, and the increasing maturity of plan populations. As plans mature, higher cash flow requirements make them more susceptible to adverse investment conditions. In this environment, trustees and plan professionals should remain proactive in monitoring key risk factors, evaluating the resilience of their funding and investment strategies, and understanding how potential economic or demographic shifts could affect their plans over both the short and long term.
About this study
The results in this study were derived from publicly available IRS Form 5500 data filed through June 2026 for all multiemployer DB plans, numbering around 1,200 plans. Data for a limited number of plans that clearly were erroneous was modified to ensure that the results were reasonable and a sufficiently complete representation of the multiemployer universe. Such adjustments were associated with an immaterial number of plans.
Liability amounts were based on unit credit accrued liabilities reported on Schedule MB and were adjusted to the relevant measurement dates using standard actuarial approximation techniques. For this purpose, each plan’s monthly cash flow, benefit cost, and actuarial assumptions were assumed to be constant throughout the year and in the future. Projections of asset values to the measurement date reflect the use of constant cash flows and monthly index returns for a simplified portfolio composed of 40% public equity, 8% private equity, 28% investment grade debt, 4% high-yield debt, 9% real assets, 2% cash and cash equivalents, and 9% other. This asset portfolio is based on the average asset mix reported on Form 5500 Schedule R, weighted based on each plan’s reported market value of assets.
Changes to an individual plan’s data or assumptions would likely not have a significant impact on the aggregate results or the conclusions in this study.
This study reports on funded percentages and levels based on one reasonable measure of funding for these plans, where liabilities are developed using each plan’s assumed return on assets as the discount rate. Other methods of measuring liabilities and funding statuses may produce different results.
1 Individual plans’ returns may have been higher or lower based on their asset allocations, asset classes, and management styles. For more information about the asset portfolio used for this study, see the About this study section.
2 For this study, six of the 161 plans are of immaterial size and were excluded.
3 Pension Benefit Guaranty Corporation. (January 27, 2026). Projections report: FY 2024. Retrieved February 6, 2026, from https://www.pbgc.gov/sites/default/files/documents/fy-2024-projections-report.pdf.