This edition of our trend series builds upon prior Milliman research demonstrating rapidly rising Medicare Part D trends, largely concentrated in the non-low income (NLI) population, incorporating data through Q4 2025. The full-year 2025 data confirm the major themes identified in earlier editions while revealing important new dynamics, including moderating trend growth in Q4, a milestone shift in GLP-1 market share, and continued acceleration in immunology and oncology drug classes.
Key findings
With the first full year of the new Part D benefit design complete, we observe stark contrast between changes in the NLI and low income (LI) populations.
In 2023 and prior years, NLI and LI trends were typically similar across top therapeutic classes and in aggregate. Trends for these two populations quickly started to diverge in 2024, with the introduction of the first true maximum out-of-pocket limit for NLI members, driving large increases in spending. The elevated trends for the NLI population continued throughout 2025, particularly for specialty drugs.
Figure 1 highlights differences in key metrics between the two populations, focusing on non-employer group waiver plan (non-EGWP) members.
Figure 1: Key metric differences between NLI and LI populations
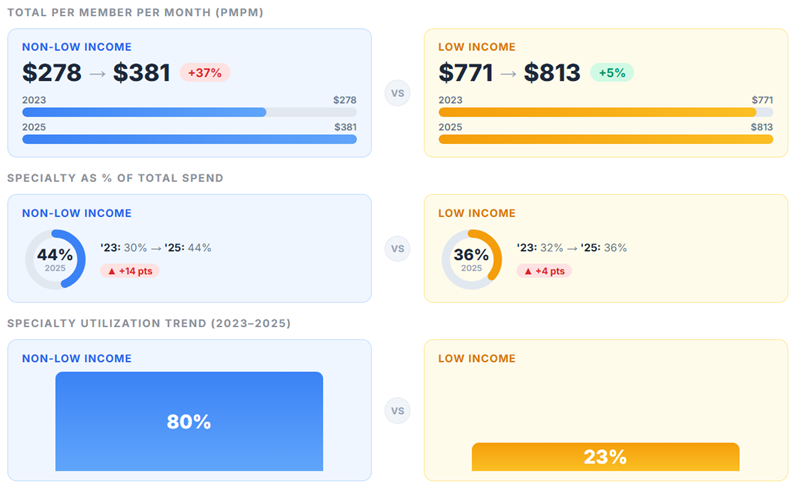
Total Part D gross cost per member per month (PMPM) increased 33% for NLI members and 10% for LI members between 2024 and 2025.
Between 2024 and 2025, total drug costs PMPM in the individual Part D market increased significantly, with trends driven by the NLI population. From Q3 to Q4 2025, we observe a 7.2% increase in NLI gross cost PMPM, significantly higher than the 2.7% increase observed from Q3 to Q4 2024.
Figure 2 shows the quarterly trend in total gross drug costs PMPM, highlighting the significant gap between NLI and LI trends in 2025. In 2023 and through most of 2024, LI and NLI trends tracked fairly similarly. Both populations saw a sharp dip from Q4 2023 to Q1 2024, driven by the movement of pharmacy price concessions to the point of sale, which reduced unit costs on average. For NLI members, the drop was less severe due to utilization trend somewhat offsetting the reduced unit costs.
Figure 2: Quarterly PMPM trend

NLI specialty drug cost growth moderates in Q4 2025 following sustained acceleration.
NLI specialty drug costs in the individual market have been the primary driver of overall trends in 2025. NLI specialty PMPM more than doubled, from $84 in Q4 2023 to $190 in Q4 2025, a 127% increase over two years. Quarterly specialty PMPM growth of 7.1% in Q4 2025 was below the 17%, 18%, and 9% quarterly increases seen in Q1 to Q3 2025 but exceeds the observed 5.8% growth from Q3 to Q4 2024. Specialty costs comprise close to half of total gross NLI costs (45%) in Q4 2025, a marked increase from 29% in Q4 2023. Note these large increases in specialty costs occurred despite an increase in utilization of lower-cost biosimilars in the autoimmune class.
Non-specialty NLI costs also showed acceleration in 2025 compared to 2024, reaching $237 PMPM by Q4 2025 (+18% year-over-year). From Q3 to Q4 2025, we observe a 7.3% increase in non-specialty gross costs, reflecting a relatively constant quarterly growth rate throughout 2025.
Figure 3 shows the NLI individual specialty versus non-specialty gross cost PMPM by quarter.
Figure 3: NLI individual market gross cost PMPM by quarter

The key drivers of the trend differ between the NLI specialty and non-specialty categories, where the specialty trend is predominantly driven by utilization trend, and the non-specialty trend is predominantly driven by changes in mix toward higher-cost products.
Figure 4: Drivers of specialty and non-specialty categories
| Drug Category | 2024 PMPM | 2025 PMPM | Utilization Trend | Unit Cost + Mix Trend |
|---|---|---|---|---|
| Specialty | $105.74 | $167.46 | 45% | 9% |
| Non-Specialty | $180.61 | $213.25 | 2% | 16% |
GLP-1s reach $66 PMPM in Q4 2025.
GLP-1 receptor agonists represent the single largest drug class in Part D by total cost and continue to grow rapidly. Combined GLP-1 PMPM across the individual—Prescription Drug Plan (PDP) plus Medicare Advantage Prescription Drug (MAPD)—Part D market reached $66.13 in Q4 2025, an increase of 92% from Q1 2024 ($34.48).
Figure 5 shows the total Part D GLP-1 gross cost PMPM by product, illustrating the shifting composition of GLP-1 spend.
Figure 5: Individual Part D GLP-1 gross cost PMPM by product

The new Better Approaches to Lifestyle and Nutrition for Comprehensive hEalth (BALANCE) and Bridge models announced by the Centers for Medicare and Medicaid Services (CMS) are intended to provide broader coverage of GLP-1s indicated for weight loss at reduced cost sharing and standardized net prices. GLP-1 utilization, particularly for Zepbound and Wegovy, is likely to grow even more rapidly in the second half of 2026 during the temporary Bridge model, as well as in 2027 if the voluntary BALANCE model is finalized.
EGWP trends remain subdued relative to individual market, reinforcing Inflation Reduction Act (IRA) impact.
Consistent with prior research, NLI specialty cost trends for EGWP beneficiaries continue to emerge significantly lower compared to NLI beneficiaries in the individual market. Over the full year 2025, NLI EGWP specialty PMPM increased 23%, compared to 57%–60% for PDP and MAPD plans. In addition, specialty utilization per 1,000 beneficiaries increased 90% from Q1 2024 to Q4 2025 in the individual market (MAPD plus PDP) among the NLI population, compared to a 42% increase over the same period among all EGWP beneficiaries (whose enrollment is >98% NLI). Since EGWP benefit designs have generally been less affected by the IRA benefit redesign, this gap continues to suggest that the elevated individual market trends are driven primarily by behavioral changes associated with the $2,000 maximum out-of-pocket cap in 2025.
Figure 6 illustrates specialty drug utilization growth since Q3 2023.
Figure 6: Specialty drug utilization per 1,000 growth since Q3 2023

Several top therapeutic classes exhibit year-over-year trends exceeding 50%.
Figure 7 summarizes the top drug classes by dollar PMPM increase for the NLI population. While GLP-1s have the largest dollar PMPM increase, the atopic dermatitis biologics class exhibited a PMPM trend exceeding 100% between 2024 and 2025—signaling rapid growth in utilization of these agents. The autoimmune agents class also showed a notable 60% PMPM trend.
Figure 7: Top drug classes by PMPM increase – NLI population

The total PMPM for the NLI population increased by almost $90 from 2024 to 2025. About two-thirds of that increase was driven by specialty medications. By comparison, the LI population PMPM increased by about $77 (despite a much larger baseline cost), of which only half was driven by specialty medications.
Future outlook for Medicare Part D cost trends
Full-year 2025 data confirm the magnitude and persistence of the NLI specialty cost trend first identified in early 2025, while Q4 2025 growth of 7.2%—lower than the 12.9% peak seen in Q2—suggests the rapid acceleration of mid-2025 may be moderating. To the extent the new benefit design introduced by the IRA drove a large share of recent high NLI trends, it may be reasonable to consider this a one-time event and that beneficiaries will adjust to the new design, with NLI trends returning to be more aligned with the LI and EGWP populations. However, it is difficult to know whether beneficiaries have already fully adjusted to the new Part D benefit, behavior will continue to evolve over the next one to two years, or elevated specialty trends are the new normal.
As Part D plans forecast costs for 2027, trends will be a challenging assumption. Even if NLI trends fully moderate beginning in 2026, costs grew so significantly throughout 2025 that applying a lower trend rate to overall average 2025 base experience will undershoot actual costs. For example, the average 2025 NLI PMPM was $381. Trending this forward to 2027 at an assumed trend of 10% would produce a projected 2027 PMPM of $461 ($381 * 1.10 ^ 2). However, if the more recent Q4 2025 PMPM of $427 was instead used as the starting point and projected forward at the same annual 10% trend, the average projected 2027 PMPM would be $499. The first method, which is most aligned with typical pricing methodologies, would underpredict costs by over 8%. This dynamic is illustrated in Figure 8. Careful consideration will be needed in 2027 bid development, and ongoing monitoring of the most recent market data will help produce the most reliable assumptions.
Figure 8: Illustrative example of trend projection methodologies: NLI PMPM

Part D plans will soon be evaluating their Q1 2026 experience to help inform final trend assumptions in their 2027 bids. In 2026, we expect to observe a moderation in gross cost increases as the implementation of maximum fair prices (MFPs) first occurs in 2026. However, low gross costs from MFPs will be offset by lower rebates on MFP drugs. Isolating MFP and other impacts will be important to differentiate between regulatory changes and true trends. Milliman will release an early look at emerging 2026 Part D claims in the second quarter.
Data and methodology
Milliman Medicare Market Intelligence (MedIntel) provided the data underpinning this white paper. The MedIntel platform is built upon CMS's 100% Research Identifiable Files (RIFs), highly enriched with supplementary data assets, and curated to address the needs of all Medicare stakeholders (plan sponsors, pharmacy benefit managers, manufacturers, providers, and others). Data is refreshed with as little as two weeks of lag, offering MedIntel subscribers near-real-time insights to support their business needs. We relied on RIFs data from January 2024 through December 2025, including claim costs from 100% of beneficiaries enrolled in Medicare Part D, excluding those enrolled in certain unique plans, such as the Program of All-Inclusive Care for the Elderly (PACE) and Limited Income Newly Eligible Transition (LI NET) Program. All cost and utilization metrics are normalized on a PMPM basis using member months by quarter, income status (LI/NLI), and plan type (PDP, MAPD, EGWP). For more information, contact your Milliman consultant.