Introduction
For decades, conventional mortgages have been underwritten and priced using Classic FICO (FICO). The approval and acceptance of VantageScore 4.0 (Vantage) and FICO Score 10T (FICO 10T) for use with Fannie Mae and Freddie Mac (government-sponsored enterprises or GSEs) introduces a new operating environment for lenders, sellers, and investors. Despite improved predictive performance of the newer scores, the policy change introduces several challenges to mortgage pricing, which Milliman has produced research on, including the effect of lender choice on mortgage default rates1 and anticipated subsequent downstream effects on pricing.2
Selected loan originators participated in a pilot program to test the use of Vantage for underwriting and pricing mortgages between May and August 2026. In early September, Freddie Mac and Fannie Mae expanded the pilot program to all originators.
This paper examines early end-consumer pricing on loans delivered during the pilot program to understand how the borrower’s interest rate differed based on the credit score identified for delivering the mortgage to Freddie Mac or Fannie Mae. Milliman analyzed 118,618 loans from Fannie Mae and Freddie Mac mortgage-backed securities (MBS) originated by United Wholesale Mortgage (UWM) and Rocket Mortgage (Rocket) between May and August 2026. The analysis indicates the mortgages originated using Vantage had an interest rate that was 9.3 basis points (bps) higher relative to a comparable loan priced under FICO. This analysis takes into consideration key loan attributes for pricing mortgages, including the 20-point adjustment for the loan-level price adjustment (LLPA).
For market analysts and MBS investors, this result is notable because two pools with identical credit score distributions may be priced differently depending on the mix of the credit score model. It is worth acknowledging that these loans were priced under the pilot program, and the interest rate differential may decline over time as more loans are priced and delivered under Vantage or FICO 10T.
Mortgage rate primer
Mortgage rates are built from several layers rather than determined by a single benchmark. The interest rate on a mortgage can be summarized as three components:
- The average cost of funds (e.g., the 10-year Treasury yield)
- The MBS spread (the spread between MBS and the 10-year Treasury)
- The primary-secondary spread (the spread between the interest rate on a given mortgage and the MBS)
The 10-year Treasury yield serves as the basis for mortgage interest rates. Generally, if the 10-year Treasury yield rises, mortgage interest rates will rise as well. The MBS spread represents the amount of interest investors of MBS require for prepayment and liquidity risk and is a function of the relative supply/demand of mortgage securities.
The primary-secondary spread is where interest rate differentiation at the borrower level occurs. It includes GSE guarantee fees, LLPAs, servicing fees, lender operating costs, capital costs, and a margin for the originator. The LLPA is an upfront percentage of the loan paid to Fannie Mae and Freddie Mac by the loan originator based on the specific risk factors of the loan. Originators pass the cost of this fee along to consumers in the form of a higher interest rate. Additional fees or discretionary pricing adjustments may also be included based on the lender’s loan pricing policy. A loan with higher expected credit risk generally correlates to a higher interest rate on the mortgage.
In September 2026, the GSEs released updated pricing grids effectively applying a 20-point score haircut for loans delivered using Vantage.3,4 This means for the purpose of determining the LLPA, a 760 FICO is equivalent to a 780 Vantage. In addition, the Federal Housing Finance Agency (FHFA) approved a Vantage adjustment on capital requirements for mortgage insurers5 (PMIERs), applying a similar 20-point score haircut when determining the capital requirement for loans priced using Vantage.
Data and methods
For this analysis, Milliman used MBS6,7 issuance data on loans both securitized and originated between May and August 2026. Milliman filtered the data to loans securitized by the two largest pilot program participants, UWM and Rocket. The other pilot program participants accounted for fewer than 1% of mortgages originated under Vantage over this period and were removed from the study. The small set of omitted borrowers does not impact the results.
Figure 1 summarizes the analysis data. The analysis contained 118,618 loans, approximately $43 billion in origination volume. Approximately 16% of loans in the data (19,563 loans) originated using Vantage.
Figure 1: MBS data summary, originations May – August 2026, UWM and Rocket
| UWM | Rocket | |||||
| Origination Month |
Loan Count |
Origination Amount ($M) |
% Vantage |
Loan Count |
Origination Amount ($M) |
% Vantage |
|---|---|---|---|---|---|---|
| 5/2026 | 15,317 | 5,943 | 3.7% | 23,871 | 8,236 | 0.2% |
| 6/2026 | 16,077 | 6,322 | 18.2% | 23,194 | 7,962 | 14.5% |
| 7/2026 | 14,143 | 5,734 | 27.3% | 18,564 | 6,019 | 34.0% |
| 8/2026 | 3,752 | 1,557 | 26.3% | 3,700 | 1,050 | 41.0% |
| Total | 49,289 | 19,555 | 16.9% | 69,329 | 23,268 | 16.2% |
The data reflect loans both originated between and included in MBS issuance between May and August. There were additional loans originated between May and August 2026 that will not appear in the MBS data until they are sold into an MBS. On average it takes roughly three months for the entire loan origination cohort to appear in the MBS data.
For each loan, Milliman calculated the LLPA fee that should have been charged according to the characteristics on the loan using the public GSE LLPA grids.8 Milliman included a 20-point haircut to credit score for loans originated under Vantage when calculating the LLPA. Milliman converted the LLPA into a mortgage rate cost assuming a five-year weighted-average life. This transformation was done to represent the way lenders pass the LLPA along to borrowers as a higher annual rate but does not affect the outcomes of the analysis.
Results
Milliman calculated the average interest rate by origination month for Vantage and FICO. Without adjusting for loan attributes, the average interest rate under Vantage was higher by approximately 5 to 12 bps across origination months. Average rates by credit score model are summarized in Figure 2.
Figure 2: Average interest rates by origination month
| Average Credit Score | Average Interest Rate | ||||||
| Origination Month | 10-Year Treasury Yield (%) |
FICO | Vantage | Difference | FICO | Vantage | Difference |
|---|---|---|---|---|---|---|---|
| 5/2026 | 4.48 | 741 | 787 | 46 | 6.34 | 6.46 | 0.12 |
| 6/2026 | 4.47 | 745 | 772 | 27 | 6.51 | 6.59 | 0.08 |
| 7/2026 | 4.60 | 747 | 769 | 22 | 6.52 | 6.58 | 0.06 |
| 8/2026 | 4.70 | 747 | 765 | 17 | 6.64 | 6.69 | 0.05 |
The difference in the average mortgage rate between loans delivered under Vantage and FICO declined over the sample period. For May, the difference between the average interest rate was 0.12%; in August, the difference between the average interest rate was 0.05%. However, mortgage rates vary by loan attributes and, importantly, the credit score of the borrower.
Milliman calculated the distribution of credit score by credit score model, and we included a version applying a 20-point haircut to loans delivered with Vantage to align with the LLPA pricing. The results are shown in Figure 3. Loans originated under Vantage showed a significant skew toward the (780, 850] credit score bin, consistent with prior research.9 However, Figure 2 shows that Vantage loans received a higher average interest rate relative to FICO.
Figure 3: Distribution of credit score by credit score model, MBS originations from May – August, UWM and Rocket only
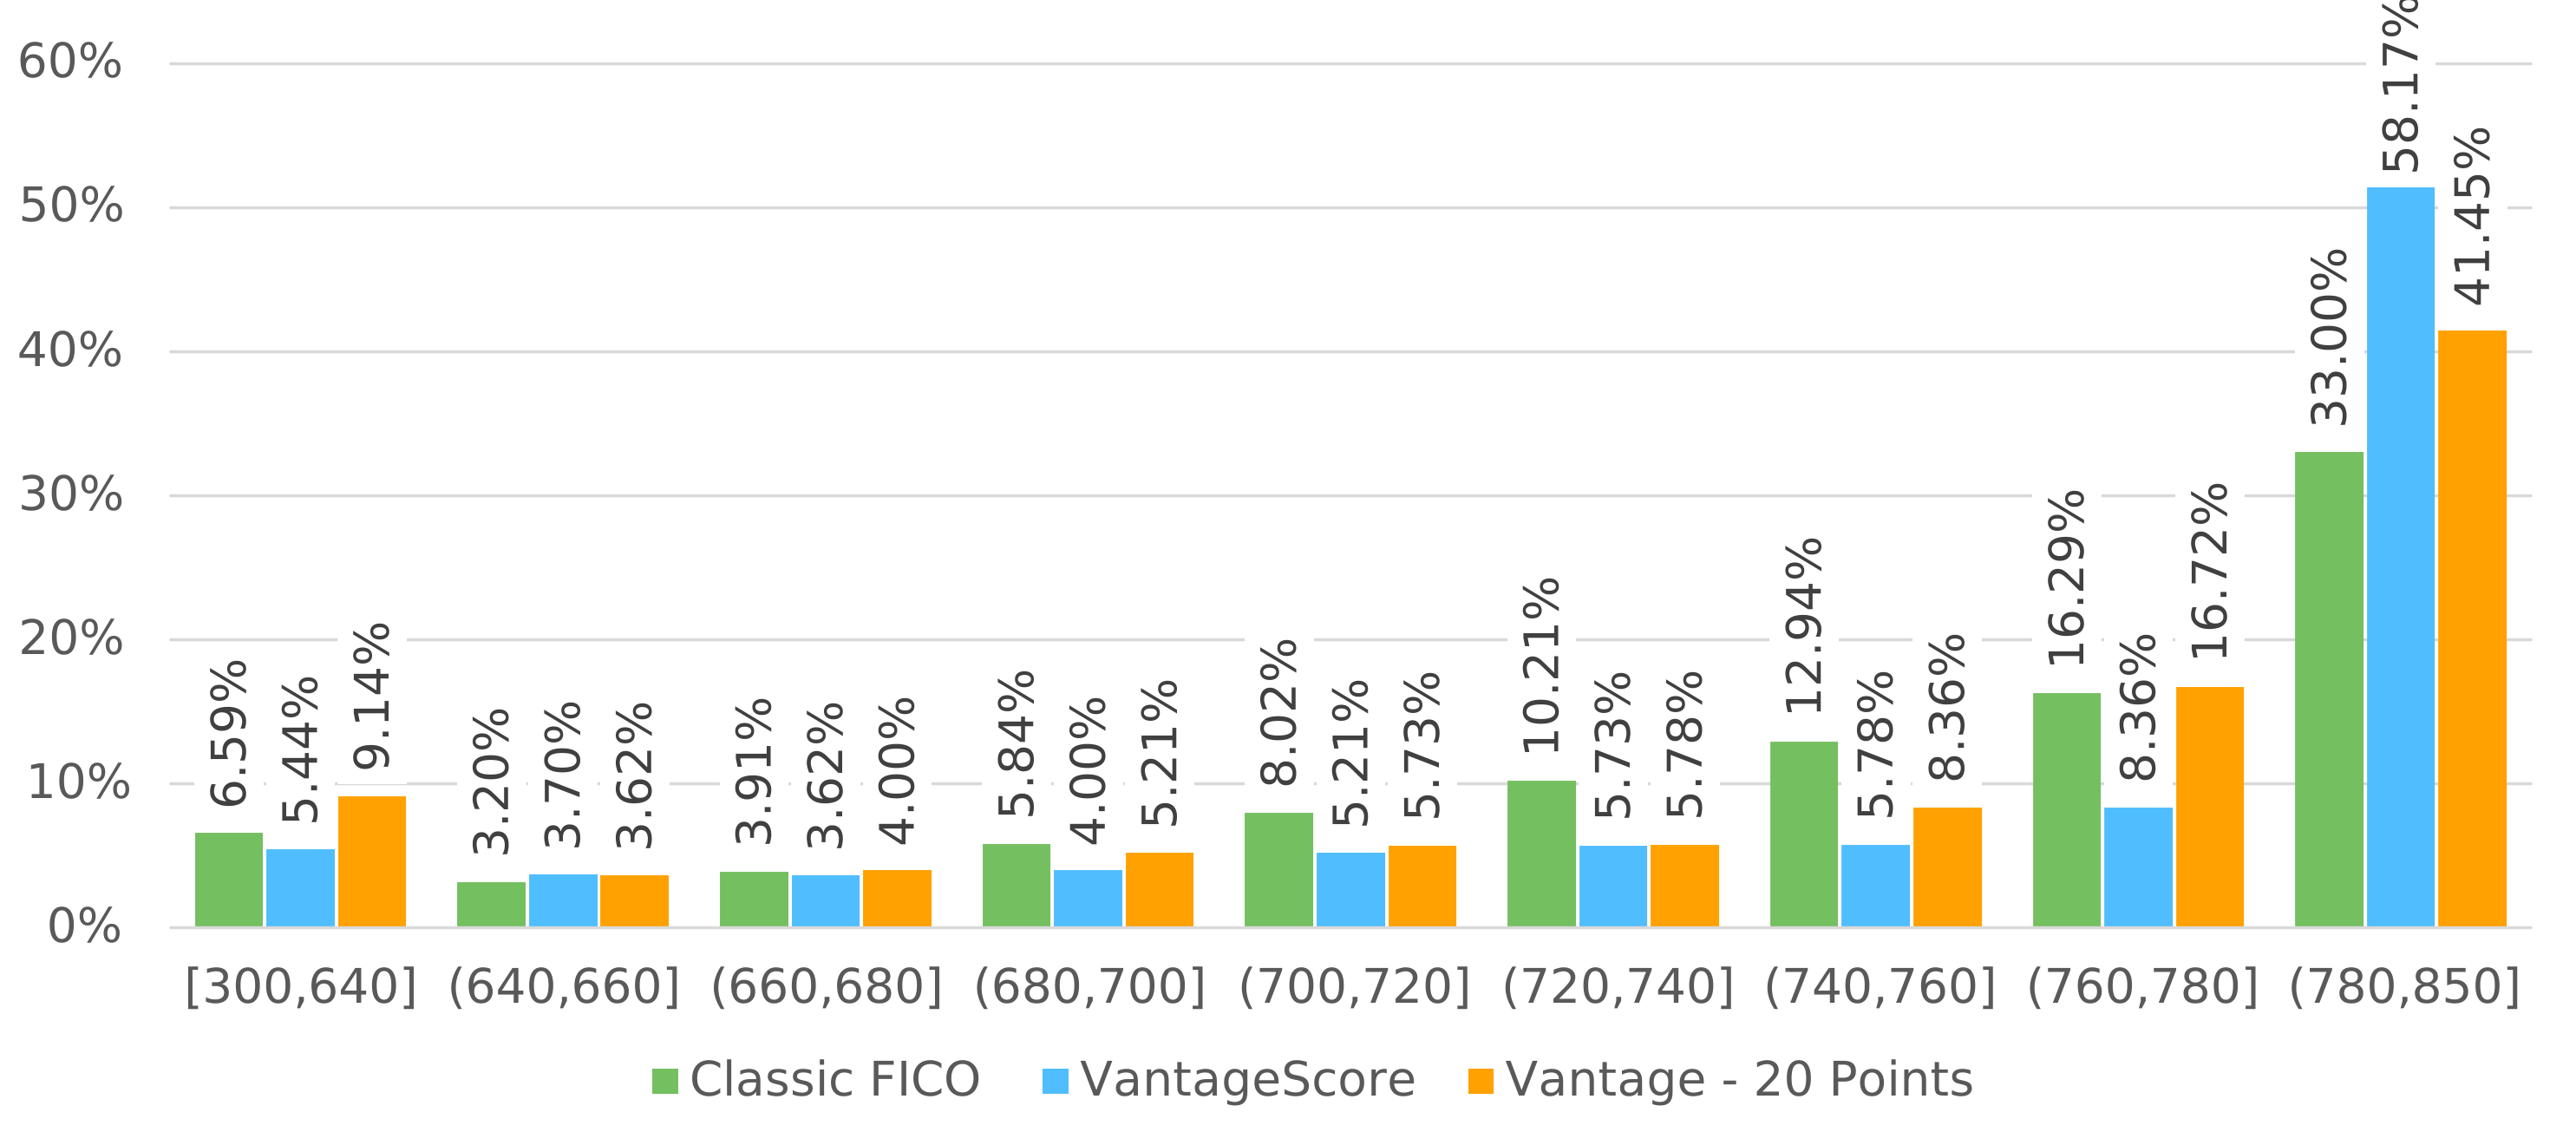
Figure 4 shows the average, 25th percentile, and 75th percentile credit score by credit score model. The average difference for July and August is approximately equal to the 20-point haircut found in the LLPA pricing grids. The 75th percentile shows a higher skew of Vantage loans with high credit scores (i.e., the difference between Vantage and FICO is higher in the 75th percentile) and a lower skew of Vantage loans with lower credit scores (i.e., the difference between Vantage and FICO is lower in the 25th percentile).
Figure 4: Credit score summary statistics
| Mean | 25th Percentile | 75th Percentile | |||||||
| Origination Month | Classic FICO | Vantage | Difference | Classic FICO | Vantage | Difference | Classic FICO | Vantage | Difference |
|---|---|---|---|---|---|---|---|---|---|
| 5/2026 | 741 | 787 | 46 | 712 | 769 | 57 | 788 | 824 | 36 |
| 6/2026 | 745 | 772 | 27 | 715 | 735 | 20 | 789 | 821 | 32 |
| 7/2026 | 747 | 769 | 22 | 717 | 729 | 12 | 790 | 820 | 30 |
| 8/2026 | 747 | 765 | 17 | 715 | 719 | 4 | 790 | 818 | 28 |
To demonstrate the interest rate difference for loans originated using Vantage across the credit score distribution, Milliman analyzed average interest rates within credit score bands across Classic FICO, Vantage, and Vantage with the 20-point haircut. The results are shown in Figure 5.
Figure 5: Average mortgage rate by credit score and credit score model
| Vantage | Vantage, 20 Point Haircut | ||||
| Credit Score | Classic FICO | Interest Rate | Difference to FICO | Interest Rate | Difference to FICO |
|---|---|---|---|---|---|
| [300,640] | 7.12 | 7.37 | 0.25 | 7.27 | 0.16 |
| (640,660] | 6.83 | 7.13 | 0.30 | 6.97 | 0.13 |
| (660,680] | 6.75 | 6.97 | 0.22 | 6.86 | 0.11 |
| (680,700] | 6.63 | 6.86 | 0.23 | 6.74 | 0.12 |
| (700,720] | 6.55 | 6.74 | 0.20 | 6.65 | 0.10 |
| (720,740] | 6.46 | 6.65 | 0.18 | 6.57 | 0.11 |
| (740,760] | 6.38 | 6.57 | 0.19 | 6.53 | 0.15 |
| (760,780] | 6.33 | 6.53 | 0.20 | 6.49 | 0.16 |
| (780,850] | 6.28 | 6.43 | 0.15 | 6.41 | 0.13 |
Within credit score bins, borrowers originated under Vantage had an interest rate within the ~20 bps range higher than borrowers originated under Classic FICO. After adjusting for the 20-point score haircut for Vantage, the difference was between 10 to 20 bps.
Beyond credit score, loan attributes influence the interest rate provided to the borrower. Milliman performed a regression analysis on the mortgage interest rate and loan pricing variables to control the influence of observable characteristics on the mortgage rate difference between Classic FICO and Vantage originations. This approach accounts for the multitude of factors that influence a mortgage rate and identifies the marginal difference between decision credit score models.
We estimated the regression line under a fixed effects ordinary least squares (OLS) model of the following form:
Mortgage Rate = Intercept + τ*Credit Score Model Type + β*Borrower Characteristics + θ*Loan Characteristics + γ*LLPA/5 + Fixed Effects
Where 𝛕 is the estimated interest rate difference observed for borrowers originated under VantageScore. Milliman introduced other covariates in stages to demonstrate how the marginal effect on the estimate for 𝛕. The symbols β,θ,γ are vectors containing coefficients for their respective variable categories. The results of this analysis are shown in Figure 6.
Credit score is measured as Classic FICO and VantageScore with a 20-point haircut. This means within the regression, a FICO of 780 is treated as 780, and a Vantage of 780 is treated as 760.
We included a saturated panel of fixed effects to control for heterogeneity by origination date, the guarantor the loan is ultimately sold to, the seller (UWM versus Rocket), and the issuance date on the loan. Interactions between origination date and seller are included to account for month-to-month movements in the underlying mortgage rate, as well as any other unobservable common effects within origination cohorts.
Figure 6: Regression results for decision credit score on interest rate
| Specification | |||||
|---|---|---|---|---|---|
| (1) | (2) | (3) | (4) | ||
| Variable | Reference | Baseline | Add Borrower Attributes |
Add Loan Attributes |
Add LLPA |
| Credit Score Type, Vantage | Classic FICO | 0.085*** | 0.095*** | 0.072*** | 0.093*** |
| Credit Score | -0.004*** | -0.004*** | -0.003*** | -0.002*** | |
| Loan to Value | 0.003*** | 0.005*** | 0.003*** | ||
| Debt to Income Ratio | 0.000 | -0.002*** | -0.002*** | ||
| Loan Amount, Natural Log | -0.127*** | -0.092*** | -0.082*** | ||
| First Time Home Buyer, Yes | No | -0.105*** | -0.096*** | ||
| Loan Purpose, Cashout Refi | Purchase | 0.397*** | 0.326*** | ||
| Loan Purpose, Rate/Term Refi | Purchase | -0.168*** | -0.162*** | ||
| Occupancy Status, Investor | Primary | 0.360*** | 0.163*** | ||
| Occupancy Status, Second Home | Primary | 0.468*** | 0.223*** | ||
| Amortization Type, ARM | FRM | -0.935*** | -0.934*** | ||
| Term, 15 Years | 30 years | -0.543*** | -0.547*** | ||
| Term, 20 Years | 30 years | -0.258*** | -0.251*** | ||
| LLPA / 5 | 0.528*** | ||||
| Fixed Effects | |||||
| Origination Date | X | X | X | X | |
| Guarantor | X | X | |||
| Seller | X | X | |||
| Issuance Date | X | X | |||
| Seller x Origination Date | X | X | |||
| Summary Statistics | |||||
| N | 118,618 | 118,618 | 118,618 | 118,618 | |
| % Vantage | 16.5% | 16.5% | 16.5% | 16.5% | |
| Average Mortgage Rate | 6.48 | 6.48 | 6.48 | 6.48 | |
| Adjusted R-Squared | 0.181 | 0.198 | 0.438 | 0.449 | |
| "Within" R-Squared | 0.158 | 0.176 | 0.420 | 0.430 | |
Model uses Heteroskedastic Robust Standard Errors, *p <= .1, **p <= .05, ***p <= .01
Looking at just the credit score, the model assigned an 8.5 bps higher interest rate to mortgages originated using Vantage relative to FICO. As loan and borrower characteristics were included in the regression, this difference increased the estimate up to 9.3 bps, after accounting for LLPAs.
Milliman performed a series of robustness checks on specification (4) to confirm that under different assumptions and permutations of the model, the interest rate differential is observed consistently. The results of these tests indicated that within permutations of the model design and assumptions, the effect was repeatedly observed.
This estimate is not a counterfactual statement about what the borrower would have been charged had they originated under Classic FICO. We do not have sufficient data to evaluate this. However, the results do indicate that for two comparable borrowers, the interest rates for mortgages originated using Vantage were higher, and this difference is not explained by observable loan characteristics in the MBS disclosure data.
With the available data, we cannot specifically identify the driver of the measured interest rate difference. The data is limited to the origination month and borrower interest rate. Differences in lender credits, discount point choices, broker compensation, interest rate lock periods, and overall execution strategies all influence mortgage interest rates. While the interest rate difference is consistently observed across origination periods, the most recent origination months indicate a 9-bps difference, which could be attributable to the aforementioned factors.
Conclusion
Milliman analyzed conventional MBS origination data from participants in the Vantage pilot program for originations from May to August 2026 contained within issuances from May to August 2026 to identify early trends and differences in mortgage pricing by credit score model. We found that loans originated under Vantage received interest rates higher on average than loans originated under Classic FICO. The data indicated that an unexplained interest rate gap of ~9.3 bps remains after controlling for observable borrower characteristics, loan characteristics, the underlying mortgage rate, and cohort effects.
Early pilot performance reflects lender selection. Relative to Classic FICO, the Vantage population in the sample had a higher concentration of borrowers at the upper end of the credit score distribution. This may indicate that lenders initially used Vantage to price borrowers with stronger observable profiles while internal processes, investor execution, and risk controls are established. The composition of pilot production should therefore be monitored alongside the rate difference.
The Vantage pilot is an early step toward a multiscore mortgage market. Its long-term success will depend not only on the predictive performance of the new scores, but also on whether lenders and guarantors can translate that performance into transparent, consistent, and economically appropriate underwriting and pricing decisions.
VI. Limitations
This analysis is based on a limited early-pilot sample. Only May through August 2026 originations that had been securitized and appeared in the available MBS data were included. July originations are not fully represented, and the Vantage share of production remains relatively small.
The sample is limited to Rocket Mortgage and United Wholesale Mortgage. Rocket Mortgage and United Wholesale Mortgage are large originators with scale, technology, and secondary-market capabilities that may differ from those of smaller mortgage companies. Their pilot pricing should not automatically be treated as representative of the entire market. Additional GSE guidance, changes to eligibility requirements, and the eventual adoption of FICO 10T may change the pricing environment. Results may differ for other sellers with different borrower channels, underwriting practices, or pricing strategies.
Borrowers originated under Vantage may differ from Classic FICO borrowers due to unobservable variables not included in the data. Factors like discount points, lender credits, and lock terms are not provided in the MBS disclosure. Regression controls reduce the effect of observable differences but cannot eliminate selection effects that are not available in the data.
Provided origination dates are indexed to the first day of the month, and the interest rate lock date is assumed to be two months prior. Because the day is not provided, Milliman cannot append the exact daily rate used to price the loan. Depending on the timing of the loan lock, the underlying interest rate may have changed, which would impact the result.
The materials in this document represent the opinion of the authors and are not representative of the views of Milliman, Inc. Milliman does not certify the information nor does it guarantee the accuracy and completeness of such information. Use of such information is voluntary and should not be relied upon unless an independent review of its accuracy and completeness has been performed. Materials may not be reproduced without the express consent of Milliman.
Appendix
Summary
Milliman performed several variations on the main regression from specification (4) to evaluate the robustness of the estimate obtained on the interest rate difference between borrowers originated under FICO and under Vantage. This section provides a brief overview of the methodology applied and the result as it pertains to the estimate. A summary of the tests is provided in Figure 7.
Figure 7: Assumption testing for estimated interest rate gap
| Question | Test | Estimated Gap(s) | Result |
|---|---|---|---|
| Does the cross-control of the LLPA fee and loan attributes bias the coefficient? | Run Interest Rate = Score Type + LLPA + Fixed Effects | 11.6 bps | Results do not change materially |
| Does weighting the results by loan amount change the outcome? | Re-run model (4) with a sampling weight for loan amount | 10.4 bps | Results do not change materially |
| Does the estimated gap change by origination month? | Re-run model (4) by origination period, remove origination date effects | 6 bps to 23 bps | May results are an outlier. Month with the lowest estimate also has the smallest sample size. Results are consistent directionally. |
| Does the May estimate drive the coefficient from the main model? | Re-estimate model (4) removing May originations | 9.1 bps | Results do not change materially |
| How does including the average mortgage rate in the model affect the outcome? | Re-estimate model (4) with the PMMS average mortgage rate, 2 months lagged | 8.6 bps | Results do not change materially |
| How does the timing of the mortgage origination affect the outcome? | Re-estimate model (4) but assign weekly PMMS rates based on the number of months between issuance and origination | 10.2 bps | Results do not change materially |
| How does changing the VantageScore haircut between Rocket and UWM affect the outcome? | Re-run model (4) assuming various VantageScore haircuts, moving individually by seller from 0 to 40 in 10-point increments | 5.7 bps to 12.5 bps | Most punitive scenario (under a 40-point haircut for both sellers) still shows an interest rate gap. Results are not driven by the assumption that Rocket and UWM both applied a 20-point haircut. |
| How does the estimated differential vary by credit score? | How does the estimated differential vary by credit score? | 4 bps to 10 bps | Interest rate gap was larger for loans with higher credit scores |
| How does the estimated differential vary across the interest rate distribution? | Run model (4) as a quantile regression for the 10th, 25th, 50th, 75th, 90th, and 99th percentiles | 5 bps to 10 bps | Borrowers on the lowest end of the interest rate distribution saw the largest increase in interest rates |
| How does swapping the LLPA variable out for direct controls for each dimension affect the outcome? | Swap out the LLPA variable with fixed effects for the LLPA cohorts (i.e., bins for FICO, LTV, etc.) | 8.3 bps | Results do not change materially |
1 For more information on the effect of lender choice on mortgage default rates, read Milliman’s article at https://www.milliman.com/en/insight/lender-choice-introduces-bias-mortgage-underwriting.
2 For more information on anticipated subsequent downstream effects on pricing, read Milliman’s article at https://www.milliman.com/en/insight/impact-lender-choice-mortgage-pricing.
3 Fannie Mae. (September 9, 2026). Loan Level Price Adjustment Matrix 09.09.2026. Retrieved September 17, 2026, from https://singlefamily.fanniemae.com/media/9391/display?utm_source=sfmc&utm_medium=email&utm_campaign=10981100&utm_term=5121337&utm_content=43463543&sfmc_id=804826675.
4 Freddie Mac. (September 9, 2026). Bulletin 2026-H: VantageScore® 4.0 Broad Seller Availability, Exhibit 19. Retrieved September 17, 2026, from https://guide.freddiemac.com/euf/assets/pdfs/Exhibit_19.pdf.
5 Fannie Mae. (July 29, 2026). Private Mortgage Insurer Eligibility Requirements Guidance 2026-01. Retrieved September 17, 2026, from https://singlefamily.fanniemae.com/media/47886/display.
6 Fannie Mae’s Data Dynamics database is available from https://capitalmarkets.fanniemae.com/tools-applications/data-dynamics.
7 Freddie Mac’s MBS data are available from https://freddiemac.mbs-securities.com/freddie/account/datafiles/singleclass/issuance.
8 Fannie Mae. (September 9, 2026), op. cit.
9 Nunez Magana, R. (September 24, 2024). Cracking the tape: What you need to know about VantageScore 4.0. Milliman. Retrieved September 17, 2026, from https://www.milliman.com/en/insight/cracking-the-tape-vantage-score-4.