Executive summary
The Military Health System (MHS) is one of the largest integrated delivery systems in the United States, serving approximately 9.4 million beneficiaries through 601 military hospitals and clinics (also known as military treatment facilities or MTFs) and a network of TRICARE retail and mail-order pharmacies, on a unified medical budget of roughly $64 billion.1
And yet most life sciences manufacturers treat the MHS as a single federal account: one profit and loss (P&L) line, one contracting strategy, one Uniform Formulary (UF) decision. This view is administratively convenient, but it is also commercially expensive. It hides variation that matters: which facilities are driving utilization, where beneficiaries are filling prescriptions, where access barriers are quietly suppressing demand, and where nonmilitary institutions may be influencing treatment selection.
Publicly available Department of Defense (DoD) Uniform Formulary Drug Utilization Reports (UFDURs) already contain enough granularity to answer these questions at the state and MTF level.2 The data are updated quarterly and cover all three dispensing channels (i.e., MTF, mail order, and retail). What has been missing is an analytical framework that organizes this data for use in commercial decisions, as formulary, utilization, and pricing data are contained in three separate and distinct government databases.
This paper discusses a four-dimensional framework for MHS access analytics (channel, geography, facility, and beneficiary mix) and applies it to a single therapeutic class (IL-17 inhibitors) as a tangible example. The point is not the IL-17 finding in isolation, but rather that any therapeutic category in the MHS can be examined this way and that the strategic insights can be generalized: concentration, white space, channel asymmetry, and competitive position by facility tier.
The companies that develop facility-level MHS analytics first will identify federal-channel opportunities their competitors may not see because they are looking at the wrong unit of analysis—if they are looking at all.
An overview of the MHS for life sciences companies
A network, not an account
The MHS provides healthcare to approximately 9.4 million beneficiaries through three statutorily distinct dispensing channels: MTF pharmacies, the TRICARE Mail Order Pharmacy (TMOP), and a TRICARE retail network of more than 41,000 pharmacies.3,4 Beneficiaries consist of approximately 1.5 million active-duty service members, 2 million family members of active-duty service members, and 5.9 million military retirees and their dependents. Together, these 9.4 million beneficiaries represent a population larger than most state Medicaid programs, making TRICARE one of the largest public sector payers. The unified medical budget request for fiscal year (FY) 2026 is $64.0 billion.5
MHS pricing and formulary development sit at the confluence of private sector pricing actions and federal, public-sector negotiations. Section 703 of the National Defense Authorization Act for Fiscal Year 2008 authorizes the MHS, via TRICARE, to purchase drugs at the price for the “Big Four” federal agencies (i.e., the VA, DoD, Coast Guard, and Public Health Service, the four largest direct federal purchasers of prescription drugs).6 The Big Four price is the lower of 1) the Federal Ceiling Price (FCP), equivalent to 76% of a drug’s nonfederal average manufacturer price (non-FAMP), or 2) the Federal Supply Schedule (FSS) price, a price negotiated between the VA and drug manufacturers, with the goal of reflecting most-favored commercial customer pricing.7 Manufacturers may also implement temporary price reductions (TPRs) to influence formulary construction and utilization management. TRICARE UF is shaped by pricing offers and clinical discretion of the DoD Pharmacy and Therapeutics Committee, with input from the Uniform Formulary Beneficiary Advisory Panel (UF BAP).
Figure 1: MHS pricing and formulary development
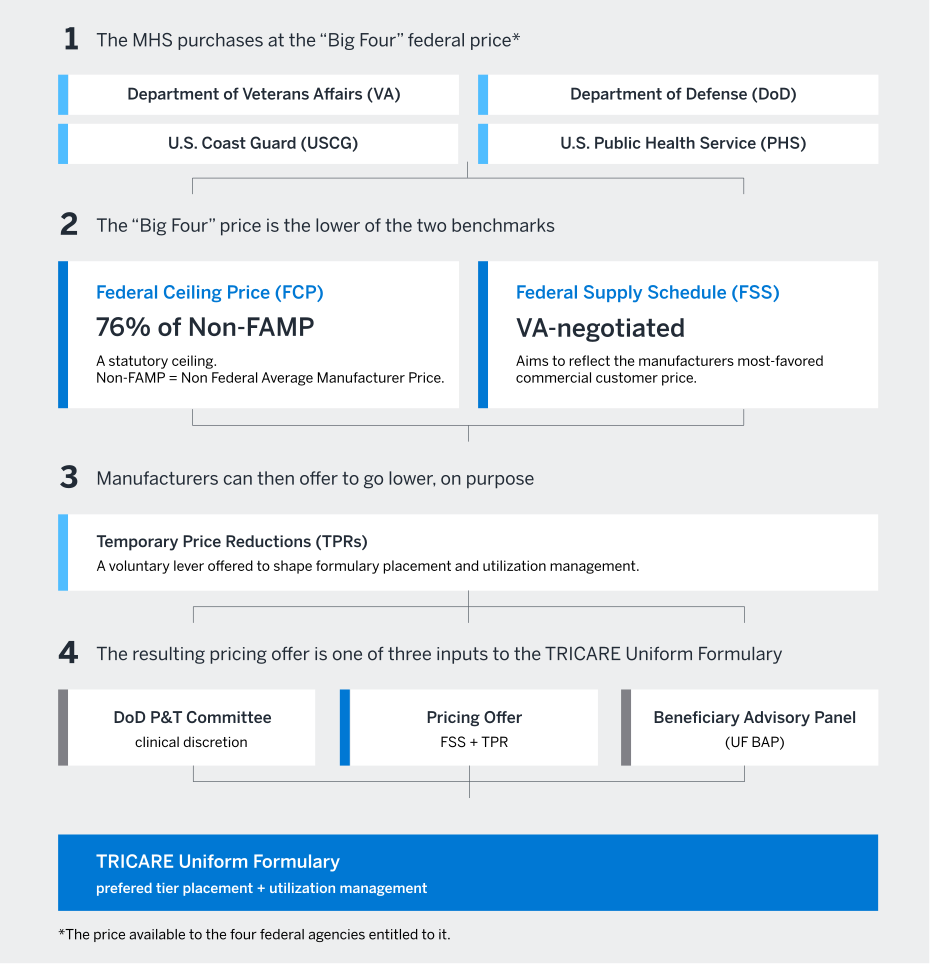
FSS and TPR strategy relies on whether a discount can unlock MHS volume through improved access, including lower utilization management or step therapy barriers.
While pricing and formulary decision making are heavily centralized functions, care delivery in the DoD is not. The MHS’s need for pharmaceuticals stems from thousands of prescribers across hundreds of facilities across the United States and around the world in three distinct dispensing channels. Manufacturers seeking to win in TRICARE need to evaluate local/contracted provider versus military provider trends, distribution model construction, and promotional footprint, and that is before making FSS offers, crafting TPR strategies, and engaging with UF influencers. Below, we provide considerations for understanding demand.
A system in transition
Adding to the strategic significance: The DoD is actively shifting beneficiary care back toward MTFs. This aligns with its goals of improving readiness of both service members and MHS healthcare professionals.8 Historically, a substantial amount of MHS care did not happen in military facilities. A 2017 Congressional Budget Office (CBO) report stated that within the United States, direct care delivered through MTFs accounted for roughly 40% of the care the system provided; the remaining approximately 60% was purchased care, delivered by civilian providers and reimbursed through TRICARE.9 As a result, the DoD is trying to reorient the delivery of care to support its long-term objectives.
A December 2023 deputy secretary memorandum directed the MHS to "reattract" at least 7% of beneficiary care from the private sector to MTFs by December 31, 2026.10 Channel mix is therefore not a static feature of this market; it is a moving target with a public timetable. Manufacturers without a facility-level view of where care is currently happening will struggle to anticipate where it is going and will therefore struggle to make a proposal that aligns with the DoD’s goals. As site of care evolves, pharmaceutical manufacturers need visibility to understand the evolution and its impact on product utilization.
The analytical gap in MHS market access data
Most market access teams know roughly the same things about the MHS:
- Aggregate volume from claims aggregators or syndicated federal-channel reports
- FCP benchmarks and FSS pricing
- UF tier status and prior-authorization requirements
- Total federal-channel spend at the manufacturer level
Most teams know far less about what is happening underneath that aggregate. Specifically:
- Which facilities are driving MTF-channel volume (e.g., the largest medical centers, mid-sized hospitals, or ambulatory clinics)?
- Which states show beneficiary concentration that is or is not matched by product utilization?
- How does channel mix vary by therapeutic class, indication, and beneficiary cohort? Specialty products skew toward TMOP, acute therapies toward retail, and certain conditions toward MTF, but these patterns differ meaningfully across categories and are rarely examined directly.
- Where does white space exist (i.e., beneficiary populations or facilities where utilization is suspiciously low relative to expected disease prevalence and/or product access)?
- How does the distribution model help the DoD to achieve its MTF reattraction goals?
The DoD publishes the UFDUR quarterly, with prescription-level detail by therapeutic class (i.e., Uniform Formulary Class, or UFC), drug product (i.e., drug/strength/form, or DSF), point of service, claim state, and MTF. The gap is an analytical gap: Most organizations are not structured to operate at this level of granularity for federal channels, and most syndicated tools do not surface it.
The key business question for MHS access analytics
The right starting question for any life sciences company examining the MHS is not, "What is my federal-channel volume?" but rather, “Where in the Military Health System is my product reaching beneficiaries—and where is it not—and what does that variance reveal about the awareness, beneficiary behavior, competitive position, and importance of formulary access?”
This question breaks down into three operational areas, each of which generates a distinct class of strategic insight.
Concentration: Where MHS utilization clusters
Where is utilization concentrated? Across the MHS service area, what does the long tail look like? Across MTFs, do the top 10 facilities account for 40% of volume or 80%? Concentration tells you where to invest field force, where to engage healthcare providers (HCPs), and where you have execution risk if a single account changes behavior.
White space: Beneficiary populations without matching utilization
Where is there beneficiary population without corresponding utilization? An MTF with several thousand enrolled beneficiaries and zero prescriptions of an on-formulary specialty product is sending a signal. The signal might be no patients, no prescribers, no referrals, or an access barrier. However, each of those answers points to a different strategic response.
Channel asymmetry: How utilization splits across MTF, mail order, and retail
How does utilization split across MTF, TMOP, and retail? A drug that is 80% mail order tells one story (e.g., chronic, mature population, beneficiary-managed); a drug that is 60% MTF tells another (e.g., acute use, infusion, limited treatment duration); and a drug that is 70% retail tells yet another (e.g., REMS requirements, cold chain storage). Channel mix indexed against therapeutic comparators reveals beneficiary behavior, prescriber routing, distribution incentives, and operational dynamics that pure volume figures cannot.
A four-dimensional framework for MHS access analytics
Answering the key business questions above requires structured analysis along four interacting dimensions. Each dimension carries information that the others do not, and each one produces a different class of decision-relevant insight.
Figure 2: Breakdown of the four-dimensional framework
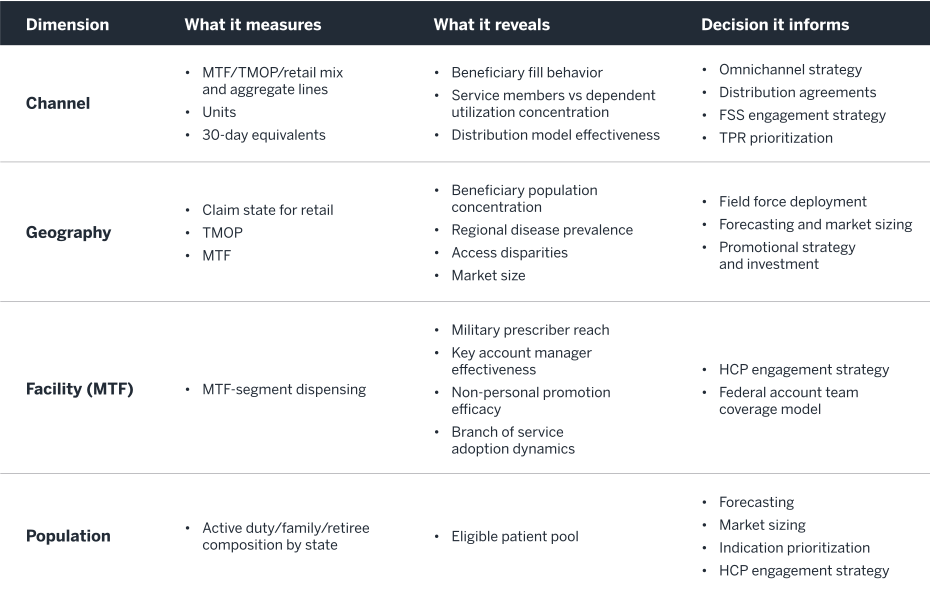
The dimensions are not independent. A specialty injectable in a state with low retiree density and one major MTF will produce a different commercial profile than the same product in a high-density state served primarily by retail network pharmacies. The framework’s value is in disciplining the analyst to examine these interactions rather than collapse them.
Applying the framework: IL-17 inhibitors in the MHS
The framework above is best understood by application. We use IL-17 inhibitors as an example, drawn from the FY26Q2 UFDUR (Jan. 1 to March 31, 2026). The therapeutic class includes four marketed agents: secukinumab (Cosentyx), bimekizumab (Bimzelx), ixekizumab (Taltz), and brodalumab (Siliq).
We chose this class for three reasons:
- It is small enough to inspect (four products).
- It has differentiated indication footprints.
- It is large enough in the MHS to produce statistically meaningful patterns.
None of the findings below depend on the choice of therapeutic class. Equivalent analyses can be performed for any UF-listed product family.
Finding 1: Concentration is severe—and it is geographic, not just facility-level
The IL-17 class generated 14,026 prescriptions across UFDUR and outliers in the quarter. The top five states (Florida, Texas, Virginia, North Carolina, California) accounted for approximately 40% of national volume, a heavy skew toward states with the largest active-duty and retiree populations. The implication is that for any product, a small number of states will drive the majority of MHS demand, and field force coverage models that distribute attention evenly across federal regions or based on census population will misallocate effort.
Finding 2: The MTF channel is highly concentrated and has a long tail
Of the 601 MTFs in the DoD’s direct-care system, only 87 reported any IL-17 utilization in Q2 FY26—about one in seven facilities. Within that 87, the top facility (JBSA Fort Sam Houston) dispensed 111 prescriptions; the median was below 10. This is the long-tail pattern that recurs across most specialty therapeutic classes in the MHS, and it has direct implications for HCP engagement strategy: A manufacturer can cover 80% of MTF-channel volume by engaging the top 15–20 facilities, but the long tail of single-digit-utilization sites is where formulary execution issues, training gaps, or prescriber transitions tend to surface.
Finding 3: Channel asymmetry is the dominant feature of the data
Approximately 80% of IL-17 volume in the quarter flowed through TMOP, about 16% went through MTF, and 4% went through retail network pharmacies. This is not surprising for a chronic, self-administered specialty injectable, but the magnitude is. It tells a manufacturer two things at once: Most beneficiaries on these products are filling at home, and the MTF-channel utilization that does occur is concentrated at facilities with specialty pharmacy capacity.
Finding 4: White space reveals untapped MHS opportunities
Two patterns are visible in what is not in the data. First, several states with substantial military beneficiary populations (including several mid-Atlantic and northern states) show notably low IL-17 utilization relative to the top quintile. Some of this is explained by population density; some is not. In this case, data may reveal opportunities to drive adoption where federal-focused key account manager (KAM) and sales teams have or have not implemented engagement strategies. Federal channel data tells you which drugs are being prescribed, but not for what. Where indication-level questions matter, federal channel analysis must be triangulated with syndicated medical claims and geospatial diagnosis data to understand the indication-specific opportunity.
Strategic implications for life sciences companies
A facility-level view of the MHS produces decisions that an aggregate-only view cannot. Five implications recur across categories.
UF prioritization, FSS negotiation, and TPR offer strategy
Like other managed markets, the MHS considers both clinical value and cost effectiveness in developing TRICARE UF. Overlaying the federal-channel economics of competitor assets with formulary status and utilization data can reveal the necessity of preferred status and easy utilization management in driving demand, while also refining the opportunity at hand in the segment.
Structuring federal account teams around facility-level data
Most federal account teams are organized by service branch or region. A facility-level utilization map suggests that deeper discussions on regional and facility dynamics may prove valuable to both the MHS and manufacturers. Manufacturers should explore ways that the long tail can receive lower-touch, programmatic engagement.
HCP engagement in military-dense geographies
Monitoring state- and facility-level performance of pharmaceuticals in the MHS can unlock important insights around the effectiveness of a manufacturer’s conventional field force, KAM infrastructure, and personal/nonpersonal promotion strategies in military-dense geographies. While MTFs may prove difficult to access for traditional rep-to-HCP messaging interactions, drugs that enjoy strong TRICARE coverage but poor federal demand may create the business case for localized, nonpersonal marketing approaches. Moreover, strong facility-level performance may be an indicator that a manufacturer should prioritize MTF-adjacent network providers who may be serving military families in off-base care settings and engage Managed Care Support Contractors (MCSCs) who coordinate civilian provider networks.
Competitive intelligence and benchmarking by facility tier
Within a therapeutic class, indexing a product against comparators by facility tier and state often reveals localized share imbalances that are invisible in national share figures. These imbalances are usually a story, and when it’s understood, that story is actionable.
Anticipating the MTF reattraction shift
The DoD’s 7% reattraction goal implies that a meaningful slice of TMOP and retail volume could migrate to MTFs by year-end 2026.11 Manufacturers that have already built a baseline view of MTF-level utilization will be positioned to detect that migration as it happens. Those that only watch aggregate numbers will be late.
Conclusion
The MHS is one of the largest and most important integrated delivery systems in the country, and many life sciences companies have largely chosen to look at it through a single, low-resolution lens. The cost of that choice is invisible because there is no counterfactual: The team that sees only aggregate federal-channel volume does not know what they are not seeing.
A facility-level view requires reframing the unit of analysis from the federal account to the network of 601 facilities, three channels, and 9.4 million beneficiaries. The companies that make that reframing first—and build the analytical capability that comes with it—will identify federal-channel opportunities that their competitors are structurally unable to see.
The IL-17 class is one example among many. Pick any product family on the UF, apply the four-dimensional framework, and the same kinds of competitive insights surface: concentration, white space, and channel asymmetry. That is what makes the question generalizable and what makes the analytical investment worth making.
Methodology note
All MHS-specific findings in this paper are drawn from the DoD Q2 FY26 UFDUR, which covers prescriptions dispensed in the United States between January 1 and March 31, 2026.12 The report includes both UFDUR records (lines with four or more prescriptions) and UFDUR outliers (lines with fewer than four prescriptions, which are excluded from the main pivot view). Aggregate utilization in this paper is defined as the sum of UFDUR and outlier records, consistent with the report’s header guidance.
UFDUR records carry both state and MTF dimensions; outlier records carry channel only. State- and facility-level analyses in this paper therefore reflect UFDUR records alone (approximately 93% of total IL-17 volume); aggregate and channel analyses include both UFDUR and outliers.
UFDUR records do not contain National Drug Codes, manufacturer prices, or patient diagnoses. Spend analyses require a separate price reference (Federal Ceiling Price for direct-purchase channels; contracted pricing for retail and TMOP). Indication-level analyses require triangulation with chart audit, claims data, or primary research.13
1 Military Health System. (n.d.) About the Military Health System. Retrieved August 17, 2026, from https://www.health.mil/About-MHS.
2 Defense Health Agency, Department of Defense. (2024). Uniform Formulary Drug Utilization Report (UFDUR). Retrieved August 17, 2026, from https://thecgp.org/images/2024/07/UFDUR-User-Guide-2024.pdf.
3 Mendez, B.H.P. (2026, January 14). Defense primer: Military Health System. Library of Congress. Retrieved August 17, 2026, from https://www.congress.gov/crs-product/IF10530.
4 Mendez, B.H.P. (2025, September 23). FY2026 budget request for the Military Health System. Library of Congress. Retrieved August 17, 2026, from https://www.congress.gov/crs-product/IF13108.
6 Congressional Budget Office. (2021, February). A comparison of brand-name drug prices among selected federal programs. Retrieved August 17, 2026, from https://www.cbo.gov/system/files/2021-02/56978-Drug-Prices.pdf.
8 Congressional Budget Office. (2017, October). Approaches to changing military health care. Retrieved August 17, 2026, from https://www.cbo.gov/system/files/115th-congress-2017-2018/reports/53137-approachestochangingmilitaryhealthcare.pdf.
10 Mendez, B.H.P. (2024, August 29). DoD plans for "stabilizing and improving the Military Health System.” Congressional Research Service. Retrieved August 17, 2026, from https://www.congress.gov/crs-product/IN12414.
11 Military Health System. (n.d.). Reports. Retrieved August 17, 2026, from https://www.health.mil/Reference-Center/Reports.
13 See, for example, the published TRICARE pharmacy program literature describing approximately $7.4 billion in annual TRICARE pharmacy spend and three primary points of service (MTF, TMOP, retail network): Lugo, A.M., Allerman, A.A., & Trice, S.K. (2019, October 30). Evolution of the TRICARE pharmacy benefit: A decade of change. Journal of Managed Care & Specialty Pharmacy, 25(11), 1195–1200. Retrieved August 17, 2026, from https://doi.org/10.18553/jmcp.2019.25.11.1195.