Key takeaways
- Prepayment behavior materially influences Valuation Manual (VM)-22 results, with rate-sensitive cash-flow variability driving reinvestment risk, duration mismatch, and scenario dispersion—especially for structured securities with embedded optionality.
- Structured tranche design directly shapes tail outcomes, as interest-only (IO), sequential, and accrual tranches exhibit significant negative convexity and extension risk compared with the stability of planned amortization class/targeted amortization class (PAC/TAC) structures.
- Scenario behavior under VM-22 amplifies these effects, with low-rate paths accelerating prepayments, compressing realized yields, and contributing disproportionately to weaker conditional tail expectation (CTE) metrics in portfolios with high optionality. At the same time, liabilities typically move in the opposite direction—falling rates increase liability present values—so asset contraction and liability lengthening occur together in the tail to worsen duration mismatches.
- PAC/TAC restructuring meaningfully improves CTE-70 and CTE-98, demonstrating that reducing optionality leads to tighter dispersion, improved reserve sufficiency, and more consistent asset-liability management (ALM) alignment—with only modest yield trade-offs.
Executive summary
Prepayment risk is a central driver of VM-22 reserve and capital outcomes, as interest-rate movements directly influence asset cash flows, reinvestment yields, and the tail scenarios used to determine required reserves. For insurers with growing allocations to structured mortgage assets such as RMBS and CMOs, the degree of embedded prepayment optionality—rather than headline yield alone—has a meaningful impact on return stability, duration behavior, and capital efficiency.
This paper illustrates these dynamics through a $1 billion portfolio case study evaluated under VM-22-consistent stochastic interest-rate scenarios. The initial portfolio is intentionally concentrated in optionality-heavy structures, including interest-only (IO) tranches, sequential pay bonds, and accrual classes. In declining-rate scenarios, these assets experience accelerated prepayments, compressed realized yields, and greater negative convexity, resulting in wider dispersion of returns and weaker downside performance. These low-rate scenarios contribute disproportionately to the Conditional Tail Expectation measures that drive VM-22 reserves, translating asset-level optionality directly into capital strain.
The portfolio is then reconstructed using protected amortization class (PAC) and targeted amortization class (TAC) tranches to demonstrate the stabilizing effect of amortization-controlled structures. While base yield declines by only a modest amount, the reconstructed portfolio produces materially tighter scenario outcomes and stronger downside performance. In the case study, the PAC/TAC portfolio improves tail returns by roughly 30 basis points at the VaR-70 level and more than 70 basis points at the VaR-98 level, resulting in an illustrative reduction in required reserves of approximately $35–$75 million on a $1 billion portfolio. These results underscore that disciplined management of prepayment optionality—through thoughtful tranche selection and portfolio construction—can materially improve reserve stability, RBC coverage, and asset-liability alignment under VM-22 without increasing risk or leverage.
Introduction
In today’s capital markets, structured assets have become an increasingly vital part of insurance company portfolios, valued for both their yield potential and their capacity to offer customized cash-flow profiles. RMBS, commercial mortgage-backed securities (CMBS), CMOs, and collateralized loan obligations (CLOs) are now prevalent in insurers’ asset allocations.
While these instruments present attractive spreads, they also bring about prepayment risk—the uncertainty related to the timing of principal repayments from the underlying loans—resulting in variable timing and amounts of the structured cash flows. As insurers increasingly allocate to these instruments for yield, diversification, and structural flexibility, the timing of principal cash flows becomes a central determinant of return volatility, duration consistency, and reserve adequacy. Under principles-based reserving (PBR) for fixed annuities, VM-22 elevates this risk further by requiring stochastic projections of assets and liabilities, thus embedding prepayment behavior directly into balance sheet measurement.
The framework captures the dynamics of interest-rate paths, reinvestment outcomes, and duration shifts across thousands of scenarios, making the interaction between structured securities and VM-22 particularly pronounced. Though PBR has been in place for years in VM-20 and VM-21, asset risks like prepayment are arguably most salient for the fixed annuity business under the VM-22 umbrella due to the asset-intensive (re)insurance demands.1 Similarly, Bermuda’s Economic Balance Sheet (EBS) framework—particularly within the context of asset-intensive reinsurance—has long mandated insurers to consider the economic impact of prepayment risk. As such, VM-22 aligns U.S. insurers more closely with Bermuda’s principles-based approach.
As asset-intensive blocks mature and become more exposed to lapsation—whether multi-year guaranteed annuity (MYGA) or seasoned fixed index annuity (FIA)—portfolio construction choices can materially influence tail outcomes, especially in environments where interest-rate volatility remains elevated. Understanding the structural forces behind prepayment variation, and how those forces manifest within VM-22 stochastic metrics, is therefore essential for sound reserving, portfolio selection, and effective ALM.
Foundations of prepayment risk for insurers
At its core, prepayment risk represents uncertainty in both the timing and the magnitude of future principal cash flows. While individual mortgage loans tend to exhibit borrower-specific (idiosyncratic) behaviors, securitized and tranched structures diversify across many individual loans and thus reflect the market relationship between interest rates and prepayment speeds. For example, decreasing interest rates accelerate refinancing and housing turnover, while rising rates slow amortization and extend weighted average life (WAL). The resulting variability manifests through several channels: path dependency, reinvestment yield impacts, duration mismatch with liabilities, and nonlinear convexity behavior.
A structured security’s sensitivity to market prepayment dynamics depends on tranche type:
- Sequential tranches repay principal in strict order, concentrating amortization variability and exposing early tranches to rapid paydowns.
- Accrual (Z) tranches accumulate interest until other tranches are paid off, offering long duration but exposing holders to extension risk if prepayments decelerate.
- IO tranches exhibit extreme negative convexity: Rising prepayments truncate interest streams, while declining prepayments increase duration and volatility.
- Protected Amortization Class (PAC) tranches provide stable cash flows across a wide prepayment band, reducing both extension and contraction risk.
- Targeted Amortization Class (TAC) tranches offer stability within narrower bands but retain more variability relative to PACs.
Life insurer prepayment risk within VM-22
VM-22 requires insurers to run large sets of interest-rate scenarios and evaluate reserves based on tail metrics such as CTE-70. Because prepayments are deeply rate-sensitive, the stochastic component of VM-22 directly drives asset-side variability. Four mechanics are especially important:
- Path dependency: Prepayment speeds are intrinsically rate-dependent. Low-rate paths boost prepayments, whereas high-rate paths decelerate them. VM-22 stochastic scenarios capture this dynamic risk, influencing reserve variability across the tail of the distribution.
- Reinvestment risk: Increased prepayments generate more reinvestment activity. In a declining rate environment, this usually results in lower portfolio yields and higher required reserves.
- Duration mismatch: Accelerated/decelerated prepayments relative to expectation will impact asset duration, impairing ALM matching. If liability cash flows stay static, a duration gap can emerge between remaining assets and liabilities, which may demand an adjusted reinvestment strategy to cover the gap, potentially resulting in a yield disadvantage.
- Liability interactions: When liabilities are rate-sensitive, such as MYGAs with shock lapse risk, prepayment risk can worsen mismatches. Low rates may simultaneously heighten asset prepayments (shortening duration) and extend liability duration as policyholders persist to take advantage of attractive guaranteed renewal or annuitization rates.
VM-22 therefore integrates prepayment behavior not as a peripheral element but as a core component of reserve determination. Portfolios with structurally unstable cash flows will naturally show larger scenario dispersion and deeper left-tail results.
Insurance portfolio design and case study framework
To illustrate how these principles materialize in practice, consider a $1 billion portfolio designed to reflect a blended block of annuity liabilities with an effective WAL of approximately 5.5 years. The portfolio consists of 70% traditional fixed-income securities across AAA to BB ratings and 30% structured securities—intentionally above industry norms to magnify the effect of prepayment-sensitive assets.
Figure 1: Base portfolio composition
| Holding | Asset Type |
Credit Quality |
Amount (USD) |
Yield (%) |
WAL (yrs) |
Duration | Convexity |
|---|---|---|---|---|---|---|---|
| Fixed-AAA | Fixed Income | AAA | 140,000,000 | 3.50 | 5.0 | 4.7 | 0.32 |
| Fixed-AA | Fixed Income | AA | 126,000,000 | 4.00 | 6.0 | 5.5 | 0.41 |
| Fixed-A | Fixed Income | A | 112,000,000 | 4.50 | 7.0 | 6.3 | 0.48 |
| Fixed-BBB | Fixed Income | BBB | 112,000,000 | 5.50 | 8.0 | 7.1 | 0.56 |
| Fixed-BB | Fixed Income | BB | 70,000,000 | 7.00 | 9.0 | 7.8 | 0.63 |
| Struct-1-Sequential | Structured | AA | 60,000,000 | 6.50 | 6.0 | 4.2 | 0.28 |
| Struct-2-IO | Structured | BBB | 54,000,000 | 12.00 | 3.0 | 1.1 | -0.85 |
| Struct-3-Accrual | Structured | BB | 45,000,000 | 9.00 | 8.0 | 5.9 | 0.22 |
| Struct-4-Sequential | Structured | A | 51,000,000 | 7.00 | 5.0 | 3.8 | 0.25 |
| Struct-5-IO | Structured | BB | 45,000,000 | 11.00 | 4.0 | 1.4 | -0.72 |
| Struct-6-Accrual | Structured | B | 45,000,000 | 14.00 | 10.0 | 7.2 | 0.19 |
Portfolio base yield: 5.53%
WAL: 5.53 years
Duration and convexity effects
The original portfolio exhibits a wide range of duration and convexity profiles, which meaningfully contribute to the observed VM-22 return dispersion. Longer duration corporate bonds (A, BBB, BB) introduce greater interest rate sensitivity, causing larger shifts in yield under stochastic rate scenarios. The inclusion of IO tranches, with their strongly negative convexity, amplifies downside variability—especially in falling rate environments where prepayments accelerate and interest is stripped away. Accrual tranches, while exhibiting positive convexity, still contribute to tail dispersion due to long WALs and extension risk. Together, these structural characteristics explain why the original portfolio shows broader yield dispersion and weaker tail performance under VM-22 scenario testing than under a best estimate path.
Selection of WAL
The chosen WAL of approximately 5.5 years was intentionally selected for this case study to represent a consciously blended block of annuity liabilities. While fresh FIAs are typically issued with seven- or 10-year terms and MYGAs generally have three- or five-year maturities, many real-world blocks are a mix of both product types at varying stages of seasoning. By assuming a blended WAL of 5.5 years, we reflect a portfolio where (a) the FIA block is seasoned and distributed across multiple years of sales, naturally shortening the effective liability duration, and (b) the MYGA block is modeled with insurers intentionally investing longer than the contractual term to reflect renewal behavior, surrender charge protection, and term premium capture. This deliberately balanced WAL assumption supports a unified liability benchmark appropriate for illustrating the VM-22 dynamics explored in this case study.
Stochastic scenario design
VM-22 prescribes a stochastic interest-rate framework built around multi-factor yield-curve dynamics, mean-reversion behavior, and volatility calibrated to long-term U.S. interest-rate history. The prescribed scenario generator (GOES) produces forward-looking economic paths that evolve over many projection years, capturing both the level and shape changes of the curve that drive reinvestment risk, duration shifts, and prepayment behavior. These scenarios form the foundation for CTE-based reserve calculations and are designed to reflect the full range of economic conditions insurers may face.
For the purposes of this case study, which focuses on a one-year horizon, we adopt a simplified approach that is functionally consistent with the GOES framework while remaining tractable for isolating asset-level effects. Rather than simulating full multi-year curves, we approximate the near-term variability of the GOES generator by applying a one-year rate shock drawn from a normal distribution with mean 0% and standard deviation of 1.5%. This calibration preserves the short-run dispersion, volatility, and rate-sensitivity embedded in VM-22 without introducing the complexity of full-path curve evolution.
Using this method, 1,000 shocked scenarios were generated, providing sufficient coverage of the distribution to highlight the influence of structural optionality—especially prepayment behavior—on portfolio returns over a one-year period. While simplified, this approach mirrors the direction and magnitude of the VM-22 framework’s short-term interest-rate dynamics closely enough to demonstrate how structured securities respond under the types of shocks central to VM-22 modeling.
Results for the original investment portfolio
The original structured allocation—with IOs, sequential pieces, and accrual tranches—exhibits wide dispersion in annualized returns:
Figure 2: Base portfolio scenario results
| Metric | Value |
|---|---|
| 10th Percentile | 4.50% |
| Median | 5.51% |
| 90th Percentile | 6.42% |
Tail metrics reflect the influence of negative convexity and extension behavior:
- CTE-70: ~5.08%
- CTE-98: ~3.87%
Figure 3: Distribution of portfolio annualized percent return – 1000 VM22 scenarios

The left-tail results are notably driven by low-rate paths where accelerated prepayments reduce IO income and force reinvestment at less-favorable rates. Conversely, high-rate paths reduce prepayment speeds, extend accrual tranches, and contribute to uncertainty in cash-flow timing. This combination of optionality effects generates a broad, asymmetric return distribution and highlights the inherent volatility of the initial portfolio under VM-22.
Insurance portfolio restructuring: Transition to PAC/TAC stability
To mitigate the extreme optionality of the structured segment, the portfolio is restructured entirely into PAC and TAC tranches. These securities are engineered to stabilize amortization schedules and maintain cash-flow predictability across a defined range of prepayment outcomes.
Figure 4: PAC/TAC portfolio composition
| Holding | Asset Type |
Subtype | Credit Quality |
Amount (USD) |
Yield (%) |
WAL (yrs) |
Duration | Convexity |
|---|---|---|---|---|---|---|---|---|
| Struct-PT-1-PAC | Structured | PAC | AA | 60,000,000 | 5.50 | 5.5 | 4.9 | 0.38 |
| Struct-PT-2-TAC | Structured | TAC | A | 54,000,000 | 7.50 | 6.5 | 5.4 | 0.44 |
| Struct-PT-3-PAC | Structured | PAC | BBB | 45,000,000 | 6.00 | 5.0 | 4.2 | 0.30 |
| Struct-PT-4-TAC | Structured | TAC | BB | 51,000,000 | 8.50 | 7.0 | 6.0 | 0.51 |
| Struct-PT-5-PAC | Structured | PAC | A | 45,000,000 | 5.80 | 4.5 | 3.8 | 0.27 |
| Struct-PT-6-TAC | Structured | TAC | BB | 45,000,000 | 9.00 | 8.0 | 6.8 | 0.55 |
Portfolio base yield: 5.40% (approximately)
WAL: 5.50 years
Duration and convexity effects
In the reconstructed PAC/TAC portfolio, duration remains broadly like the original portfolio, but the convexity profile is substantially improved. PAC tranches provide stable effective duration and positive convexity by design, protecting cash-flow timing across a wide band of prepayment environments. TAC tranches introduce modest variability but still behave more predictably than IO or long accrual tranches. This shift toward more stable convexity reduces both prepayment-driven volatility and reinvestment risk. As a result, the reconstructed portfolio demonstrates tighter dispersion, higher CTE yields in tail scenarios, and reduced sensitivity to extreme rate movements within the VM-22 stochastic framework.
Figure 5: PAC/TAC scenario results
| Metric | Value |
|---|---|
| 10th Percentile | 4.90% |
| Median | 5.45% |
| 90th Percentile | 5.90% |
| CTE-70 (approx.) | 5.36% |
| CTE-98 (approx.) | 4.63% |
Risk reduction and quantitative impact
Figure 6: Histogram of portfolio returns

Comparing structural risk profiles
The contrast between the original and reconstructed portfolios underscores how structural design directly shapes the interest-rate sensitivity and convexity characteristics driving VM-22 return dispersion. The original portfolio’s mix of sequential, IO, and accrual tranches embeds significant optionality and nonlinear cash-flow behavior, which manifests as greater downside volatility in adverse rate scenarios. By transitioning to a PAC/TAC structure, the portfolio exchanges optionality-driven uncertainty for more predictable amortization patterns, tightening the dispersion of returns and improving tail performance. This structural refinement highlights the value of tranche selection in aligning asset behavior with VM-22 reserve objectives.
Figure 7: Scenario yields ranked by VAR percentile
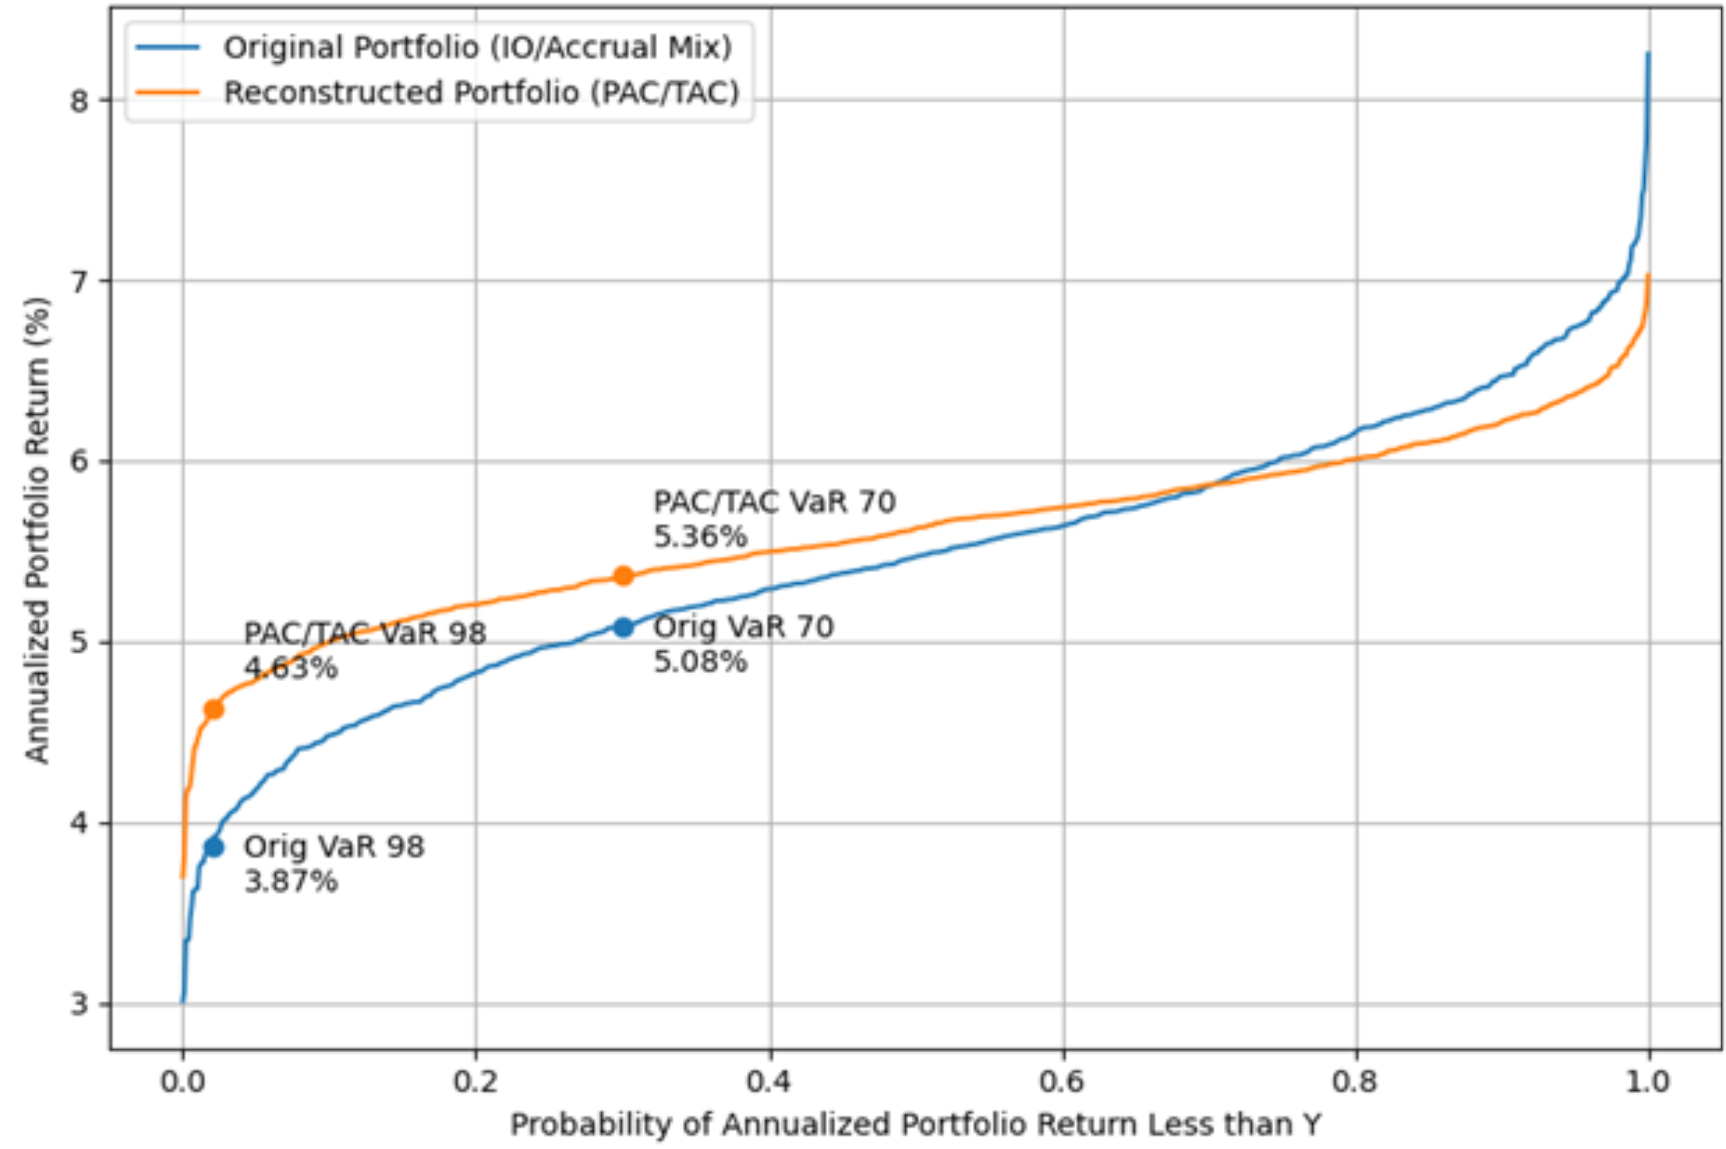
Figure 8: Reserve and TAC impacts at VAR-70 and VAR-98
| Metric | Original Portfolio (IO/Accrual Mix) |
Reconstructed Portfolio (PAC/TAC) |
Improvement |
|---|---|---|---|
| VaR-70 | 5.08% | 5.36% | +28 bps |
| VaR-98 | 3.87% | 4.63% | +76 bps |
The reconstructed PAC/TAC portfolio demonstrates material uplift in both VaR-70 and VaR-98, reflecting reduced prepayment sensitivity and more stable cash-flow behavior under adverse VM-22 stochastic scenarios, and only a small amount of yield (5.53% to 5.40% approximately) is sacrificed to bring about this stability.
- The 28-bps improvement in VaR-70 indicates significantly stronger performance across a broad range of unfavorable scenarios.
- The 76-bps improvement in VaR-98 shows especially meaningful enhancement in the extreme tail, where structured optionality risk is most pronounced.
These improvements are a direct consequence of reduced prepayment volatility, more stable duration, and less extreme convexity behavior. By replacing high-optional tranches with stability-engineered PAC/TAC structures, the portfolio achieves tighter scenario dispersion and enhanced resilience under VM-22.
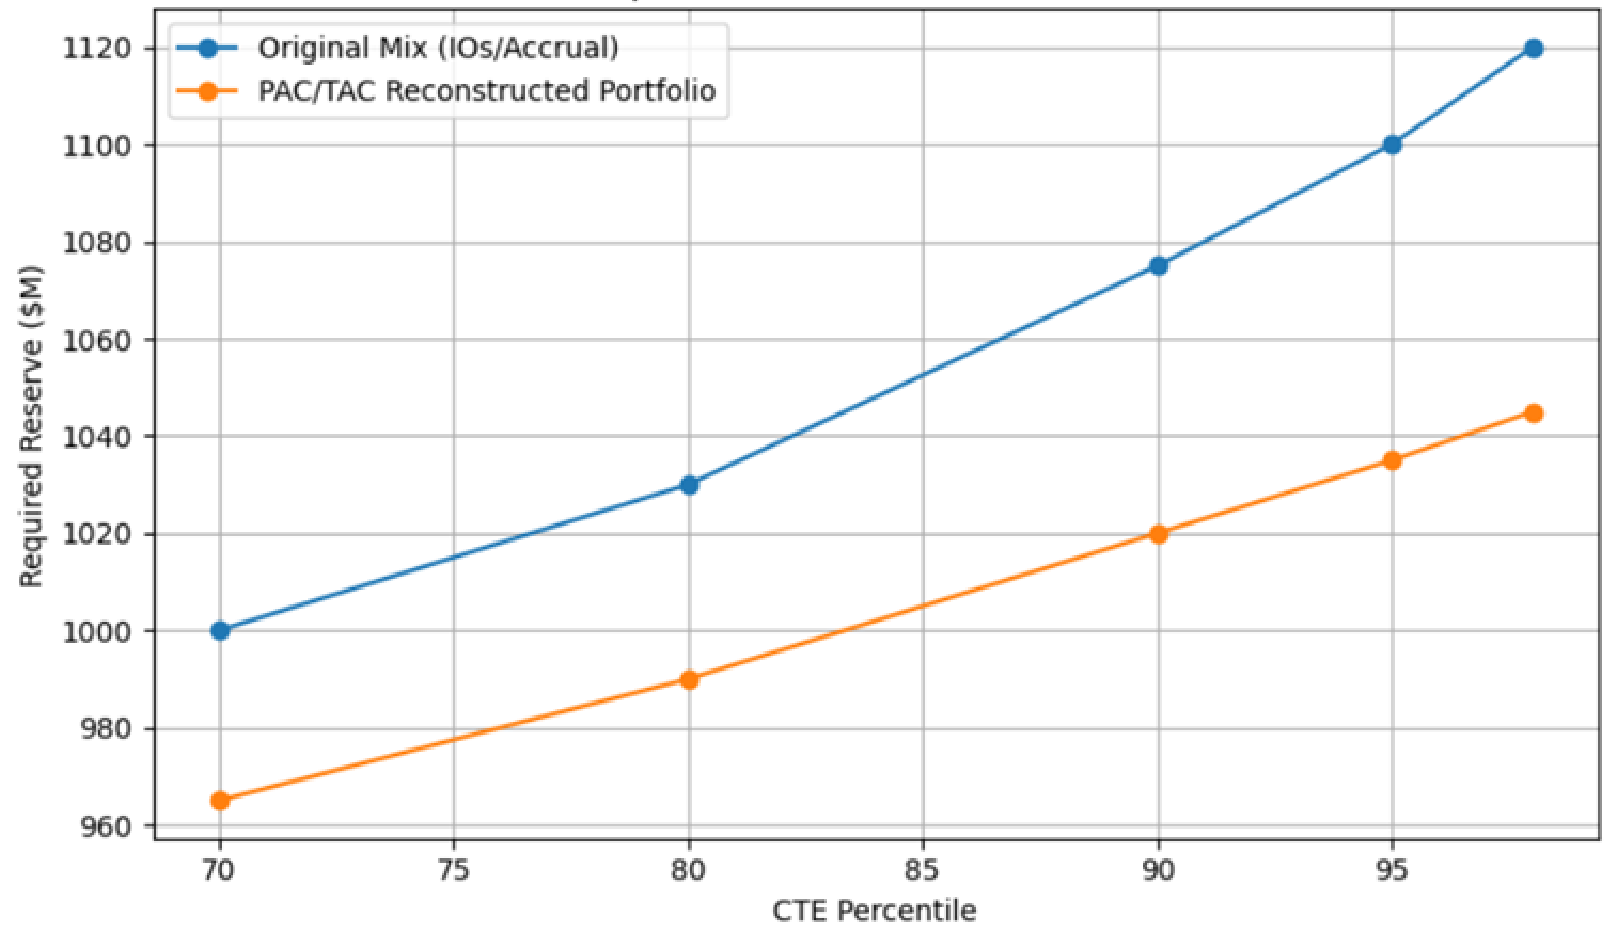
Translating CTE tail improvements into reserve and RBC ratio impacts
The tightening of the return distribution under the PAC/TAC reconstruction does more than reduce asset-level variability—it also directly strengthens VM-22 reserves and improves the company’s statutory capital position. Because VM-22 establishes the reserve as a CTE measure across stochastic scenarios, reductions in left-tail outcomes flow mechanically into lower required reserves. This, in turn, increases the available surplus, thereby improving the company’s risk-based capital (RBC) coverage ratio.
To illustrate this connection, we translate the improved tail returns from the two portfolio designs into corresponding reserve levels. The mapping uses a liability profile with a calibrated statutory liability present value and applies the VM-22 margin factors consistently across both portfolio configurations. While the absolute reserve amounts depend on company-specific assumptions (liability cash flows, reinvestment spreads, discount rates, and attribution of asset paths to liability adequacy), the relative change illustrates the embedded capital sensitivity.
In Table 6 we summarize the reserve outcomes and the resulting RBC coverage ratios under two key VM-22 percentile metrics—CTE-70, the prescribed reserve basis, and CTE-98, the upper stress calibration often used for internal risk budgeting.
Figure 9: Reserve and TAC impacts at key CTE levels
(Illustrative values based on the relative CTE improvements seen in the case study)
| Metric | Original Mix (IOs/Accrual) |
PAC/TAC Reconstructed Portfolio |
Improvement |
|---|---|---|---|
| CTE-70 Return (%) | 5.08% | 5.36% | +28 bps |
| Required VM-22 Reserve (CTE-70) | $1,000M | $965M | –$35M |
| CTE-98 Return (%) | 3.87% | 4.63% | +76 bps |
| Total Asset Requirement (CTE-98) | $1,120M | $1,045M | –$75M |
| RBC Coverage Ratio | 350% | 579% | +229 pts |
Interpretation
Reserve impact
Because VM-22 reserves are driven by tail performance, even modest improvements in the lower-percentile return paths can materially shift required reserves. The PAC/TAC portfolio’s tighter dispersion reduces the reserve by approximately:
- 3.5% under CTE-70
- 6.7% under CTE-98
These reductions translate directly into statutory surplus gains.
RBC coverage ratio impact
The additional surplus flows directly into the numerator of the RBC coverage ratio, while the denominator (required capital) changes only slightly due to improved asset risk charges and reduced covariance impacts. The result is an increase in the capital coverage ratio of 229 points.
This improvement strengthens the company’s solvency position and enhances rating agency capital adequacy metrics.
Figure 10: Reserve requirement vs. CTE percentile (illustrative)
Prepayment risk and VM-22: Linking structural theory to quantitative outcomes
The results of the case study bring earlier theoretical ideas to life. The original portfolio—with its mix of IO, sequential, and accrual tranches—clearly demonstrates how embedded optionality can widen the range of outcomes. Because the cash flows on these assets respond so strongly to shifts in prepayment behavior, even small changes in interest rates ripple through the scenarios and create a noticeably broader dispersion of returns. What the theory predicts is precisely what the numbers confirm.
This dynamic becomes even more apparent in the tails of the distribution. In the low-rate scenarios where prepayments speed up, the portfolio’s yield compresses as interest streams disappear early, and reinvestment opportunities become less attractive. Those same mechanisms, described earlier as core drivers of prepayment risk, show up again as the primary contributors to weaker CTE performance in the original structure.
Once the portfolio is restructured into PAC and TAC tranches, the tone of the results changes. These stability-oriented structures absorb much of the prepayment variability, keeping amortization more predictable and limiting the duration swings that dominated the original portfolio. As a result, the simulation outcomes tighten noticeably, and both CTE-70 and CTE-98 improved—reflecting the reduced sensitivity of the cash flows to the exact shape of the interest-rate paths.
This structural refinement also supports stronger alignment with liability behavior. By curbing optionality, the portfolio avoids the sharp duration shifts that can arise when assets shorten while liabilities extend or vice versa. For blocks of business like MYGAs, where renewal activity or shock lapses can already create liability variability, having assets that behave more consistently helps maintain a steadier ALM position under VM-22.
Strategic takeaways for insurers
The interaction between prepayment behavior and the VM-22 reserve framework has direct and practical implications for insurance portfolio strategy. Interest-rate paths, borrower behavior, and structural tranche design collectively shape cash-flow variability and tail outcomes, making prepayment exposure a critical determinant of both return stability and reserve requirements under VM-22.
Portfolios with significant embedded optionality—such as those heavily allocated to IOs, sequential pay bonds, and accrual structures—tend to exhibit wider scenario dispersion and weaker downside outcomes, particularly in low-rate environments. In contrast, amortization-controlled structures like PACs and TACs deliver more predictable cash flows, tighter return distributions, and improved tail performance, while preserving overall duration alignment and most of the portfolio’s yield profile.
In practice, effective portfolio construction under VM-22 requires intentional management of prepayment risk, supported by scenario-based analysis and thoughtful tranche selection that aligns asset behavior with liability dynamics. Insurers that integrate these considerations into their investment process can reduce reserve volatility, improve capital efficiency, and build portfolios that perform more consistently across a wide range of economic conditions.
Figure 11: Sidebar - Full VM-22 GOES vs. case study scenario approximation
| Feature | Full VM-22 GOES framework |
Case study approximation (1-Year horizon) |
|---|---|---|
| Projection length | Multi-year, full-curve projections extending across the asset and liability horizons | 1-year horizon focused solely on near-term rate shocks |
| Model structure | Multi-factor, yield-curve model capturing level, slope, and curvature dynamics | Single-period shock applied to short-rate, approximating the near-term variability of GOES |
| Mean reversion | Explicit multi-period mean-reverting dynamics embedded in the generator | Implicitly reflected through shock calibration; no multi-period evolution modeled |
| Volatility calibration | Based on long-run U.S. interest-rate history across multiple maturities | Calibrated approximately to the short-term rate volatility observed in GOES (σ ≈ 1.5%) |
| Rate path behavior | Produces full paths, including periods of rising/falling rates, curve shifts, and persistent trends | Produces isolated one-year rate changes that reflect the direction and magnitude of GOES shocks without curve evolution |
| Complexity | High—requires full scenario engine and integrated liability/asset modeling | Moderate—intended for isolating asset-level optionality and prepayment effects |
| Purpose within VM-22 | Drives CTE-based reserve calculations and long-term ALM consistency | Demonstrates how asset structures respond to GOES-consistent short-term dispersion |
| Use cases | Regulatory reporting, full principle-based reserve determination | Analytical case studies, portfolio sensitivity analysis, structural comparisons |
1 One exception could be Registered Index-Linked Annuities in VM-21, which, like fixed annuities, are supported predominantly by general account assets.
References
- National Association of Insurance Commissioners (NAIC). Valuation Manual: VM-22 — Principles-Based Reserves for Life Products. NAIC, Kansas City, MO, current edition.
- Society of Actuaries (SOA). Principles-Based Reserves: Investment Risk and Asset Modeling. Society of Actuaries, Schaumburg, IL, updated practice notes and research reports.
- Fabozzi, F. J. Bond Markets, Analysis, and Strategies. 10th ed., Pearson Education, 2021.
- Hayre, L. S. (Ed.). Salomon Smith Barney Guide to Mortgage-Backed and Asset-Backed Securities. John Wiley & Sons, 2001
- Fabozzi, F. J., Bhattacharya, A. K., & Berliner, W. S. Mortgage-Backed Securities: Products, Structuring, and Analytical Techniques. John Wiley & Sons, 2016.