This article summarizes the key financial results of medical professional liability (MPL) specialty writers for 2025 and marks our 16th consecutive year of tracking and publishing these results in Medical Liability Monitor.
Our analysis is based on the collective financial performance of a large group of insurers specializing in MPL coverage. Milliman analyzed 20 years of statutory financial data aggregated by S&P Global Market Intelligence. The current composite includes 160 MPL specialty companies with total direct written premium (DWP) of nearly $8.6 billion in 2025.
Consistent premium growth continued in 2025
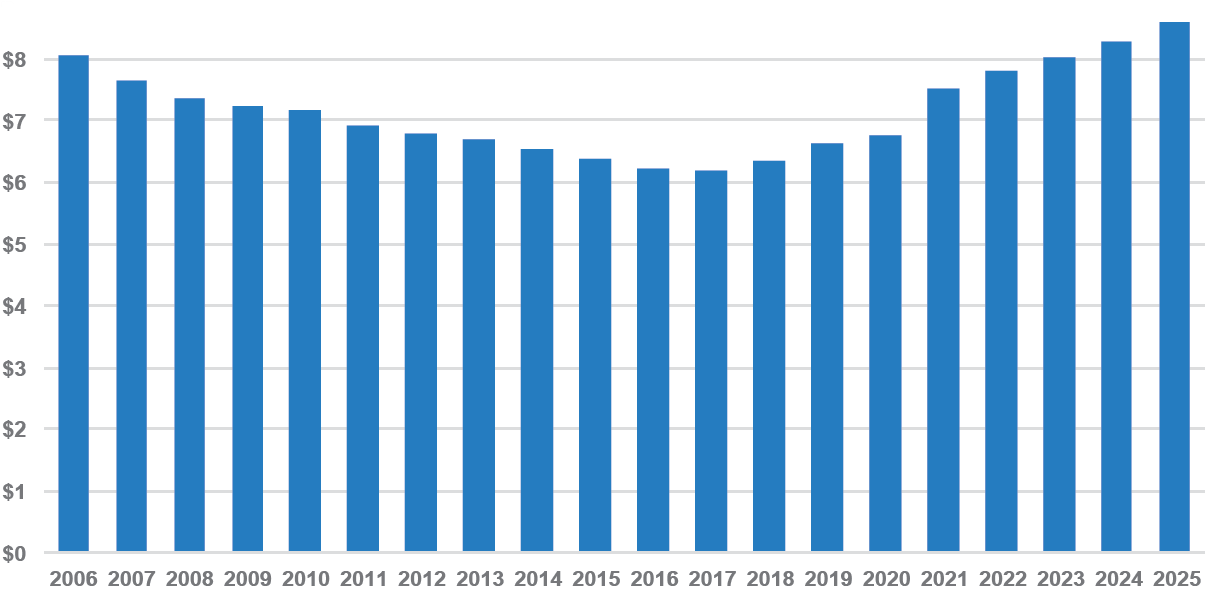
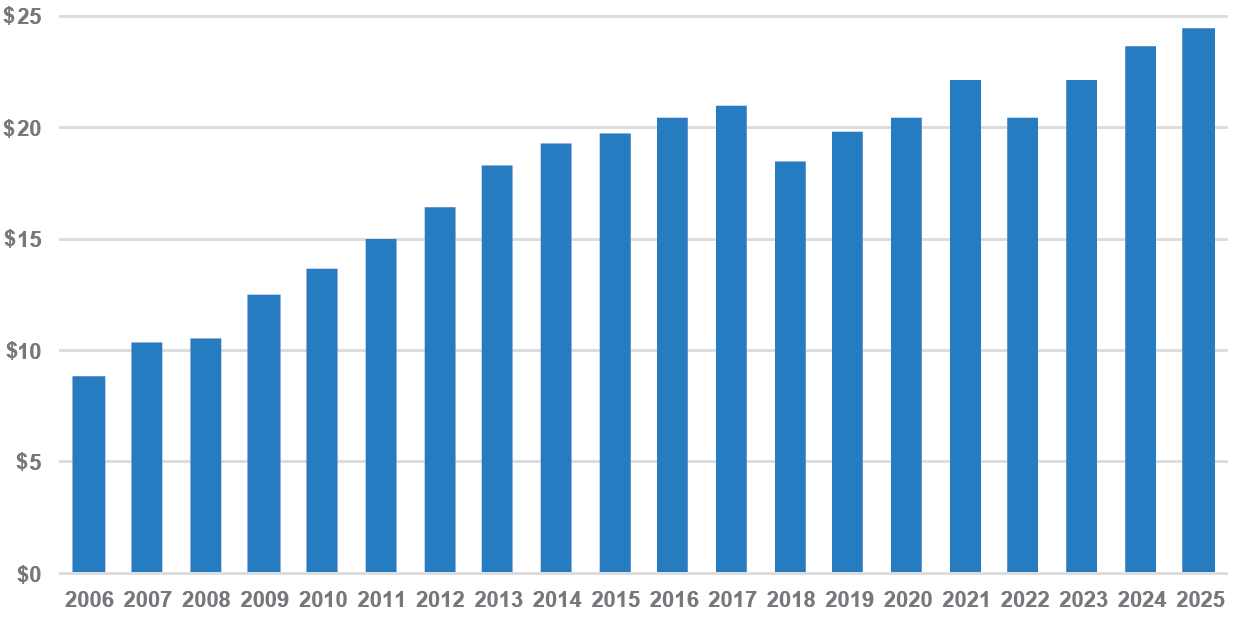
Our composite’s total DWP increased by 3.6% in 2025 to nearly $8.6 billion (Figure 1), consistent with growth levels from 2022 through 2024. While MPL premium growth has remained steady in recent years, diversification into other segments has increased. More than 7% of 2025 DWP came from non-MPL lines, led by other liability, with some carriers also writing coverages such as product liability and workers’ compensation.
Figure 1: Direct written premium ($billions)
Reserve releases stabilize
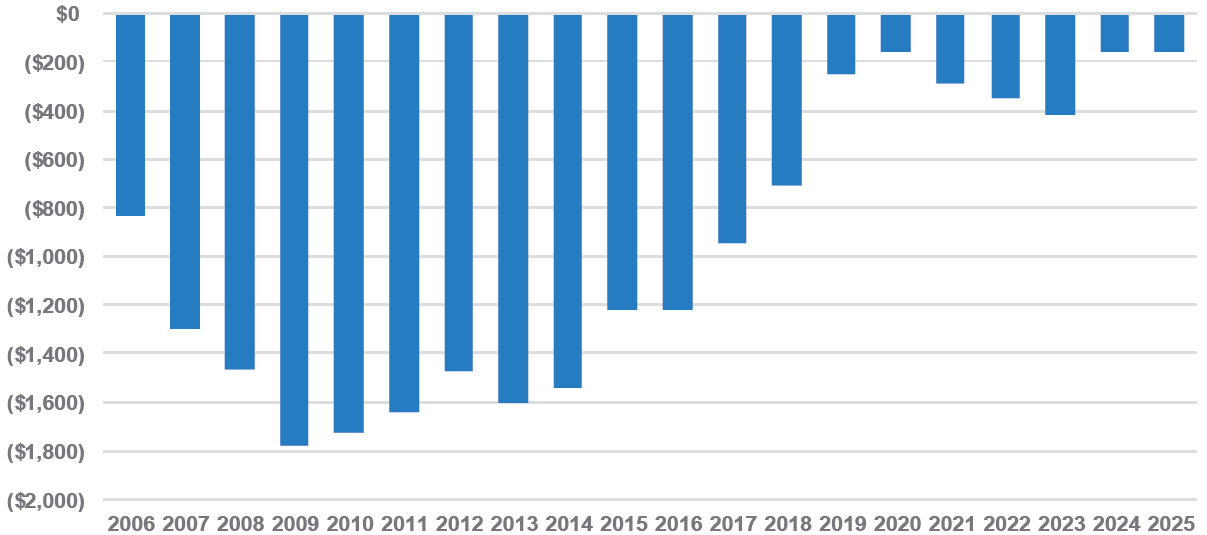
As shown in Figure 2, prior-year reserve releases for our composite totaled just over $150 million in 2025, nearly identical to the amount released in 2024. Interestingly, the distribution of reserve activity among companies was also nearly identical year over year, with approximately 60% of companies releasing prior-year reserves in 2025 and 40% strengthening prior year estimates. This compares with a markedly different split of 85% to 15% 15 years ago, reflecting the decline in prior-year reserve releases. Reserve adequacy has been tested in recent years as claim cost estimates have matured and payment activity has ramped up following COVID-related delays.
Total direct MPL payments for our composite, as measured by Supplement A to Schedule T, reached $4 billion in 2025 for the first time. This represents an increase of more than 14% from 2024 and 81% from 2021, when payments were at a 20-year low due to pandemic-related slowdowns.
An analysis of reserve development by coverage year in Schedule P shows that ultimate loss and LAE ratios have developed favorably in five of the past nine coverage years relative to initial estimates. However, the booked loss and LAE ratio for coverage year 2018 has deteriorated by 5 percentage points since year-end 2018, while coverage years 2019, 2023 and 2024 have remained flat or increased slightly from their initial estimates. This trend may partly reflect lower initial loss and LAE ratios booked in recent years. The most recent five coverage years averaged an initial loss and LAE ratio of 84%, compared with a 90% average for the preceding five-year period.
Figure 2: One-year reserve development ($millions)
Combined ratio begins to climb again
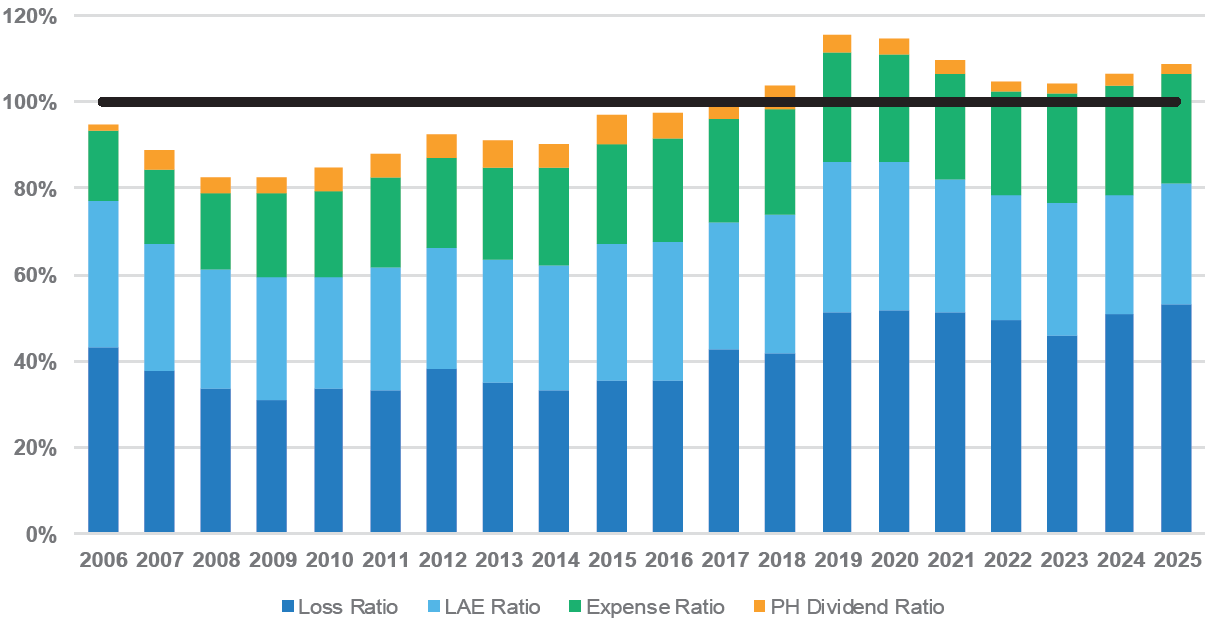
Our composite posted its ninth consecutive year of underwriting loss in 2025, with a combined ratio of 108.6%. As shown in Figure 3, the calendar-year loss and LAE ratio deteriorated by 2.5 points compared with 2024, while the underwriting expense ratio and policyholder dividend ratio remained virtually unchanged.
LAE — as a share of total loss and LAE — continues to decline, with just one-third attributable to incurred LAE. This contrasts with 15 years ago, when the split between losses and LAE was closer to 50/50.
Figure 3: Combined ratio
Net income remains strong
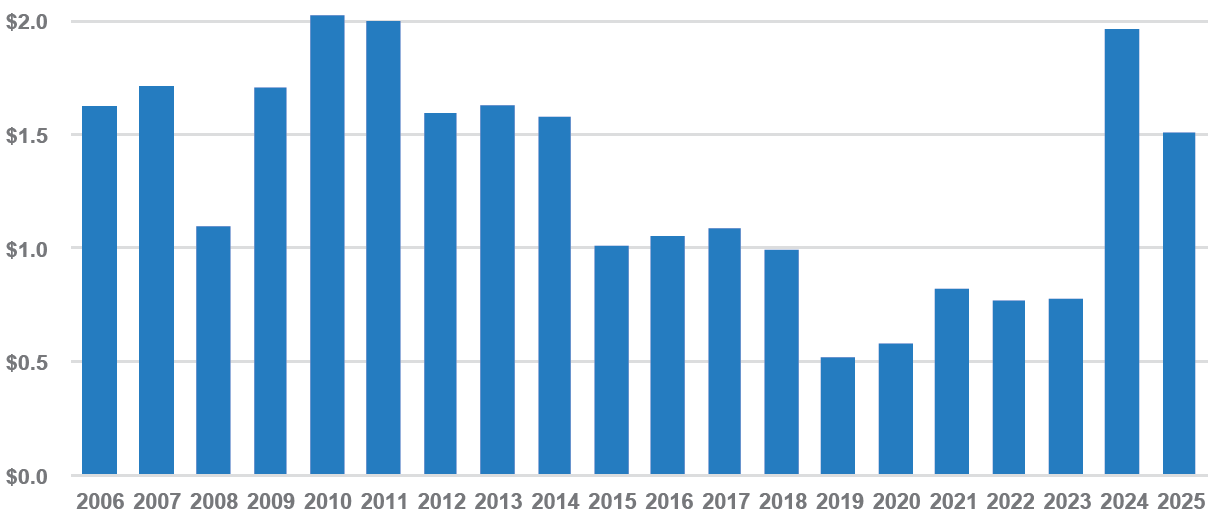
After-tax net income for our composite was approximately $1.5 billion in 2025 (Figure 4). Although this represents a decrease from 2024, excluding one company’s outlier realized capital gains in 2024 would show a stronger bottom line in 2025. This improvement comes despite a deterioration in underwriting results during the year. Net income was buoyed by a 13% increase in investment income and a second consecutive year of massive net realized capital gains, with 2025 ranking just behind 2024 as the highest level in the past 20 years.
Figure 4: Net income ($billions)
Surplus grows again
As shown in Figure 5, our composite’s policyholder surplus grew by 3.2% in 2025 to approximately $24.5 billion, marking another all-time high. As noted, net income for the year exceeded $1.5 billion, while changes in unrealized capital gains contributed an additional $130 million.
After aggregating total adjusted capital and authorized control level risk based capital (RBC) amounts across the composite, the resulting RBC ratio increased from approximately 1,040% in 2024 to 1,150% in 2025, indicating a strong capital position relative to regulatory action thresholds.
Figure 5: Policyholder surplus ($billions)
Conclusion
As has been the case for nearly a decade, the MPL industry will need to keep advancing toward stronger underwriting performance. For now, however, underwriting losses are more than offset by investment returns. Capitalization also remains robust, exceeding that of most other lines of business and comfortably above regulatory thresholds.
Our composite recorded a strong operating margin of nearly 25% in 2025. As the market enters 2026, industry performance will hinge on rate adequacy, risk selection and proactive claims management, with investment returns likely to remain a key swing factor. We will continue to track MPL results and developments and share further insights in future editions of Medical Liability Monitor.
The previous edition of this series can be read here.
Eric Wunder is a principal and consulting actuary, and Zach Fischer is a consulting actuary, at Milliman Inc., an independent actuarial and consulting firm.
This article first appeared in the April 2026 issue of Medical Liability Monitor: http://www.medicalliabilitymonitor.com/.