Public pensions funded ratio climbs to 72.6% in Q3 2020, up from 70.7%
Funded status improves by $89 billion in Q3 2020
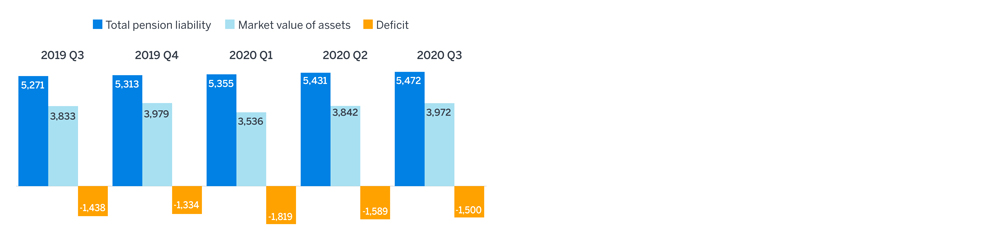
The third quarter (Q3) of 2020 continued the upward trend in asset returns for public pensions, reflecting continued strong growth in markets following the initial COVID-19-induced economic impact in Q1. Q3 investment gains propelled the estimated funded status of the 100 largest U.S. public pension plans from 70.7% at the end of June 2020 to 72.6%at the end of September 2020, as measured by the Milliman 100 Public Pension Funding Index (PPFI). The deficit shrank to $1.500 trillion at the end of September 2020, down from $1.589 trillion at the end of June 2020. However, the extent to which the pandemic will impact plan sponsors’ ability to fund public pensions remains uncertain.
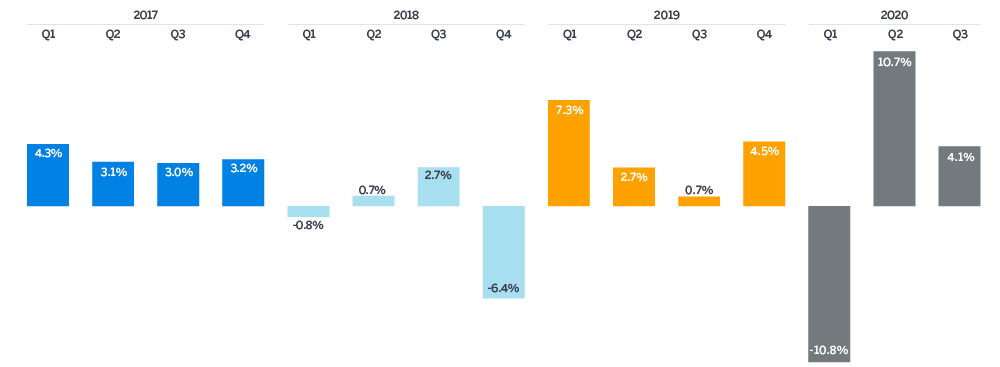
In aggregate, the PPFI plans experienced investment returns of 4.14% in Q3, with individual plans’ estimated returns ranging from 2.45% to 5.84%. The Milliman 100 PPFI asset value increased from $3.842 trillion at the end of Q2 2020 to $3.972 trillion at the end of Q3 2020. The plans gained market value of approximately $155 billion, which was offset by approximately $25 billion flowing out, as benefits paid out exceeded contributions coming in from employers and plan members.
FIGURE 1: FUNDED RATIO
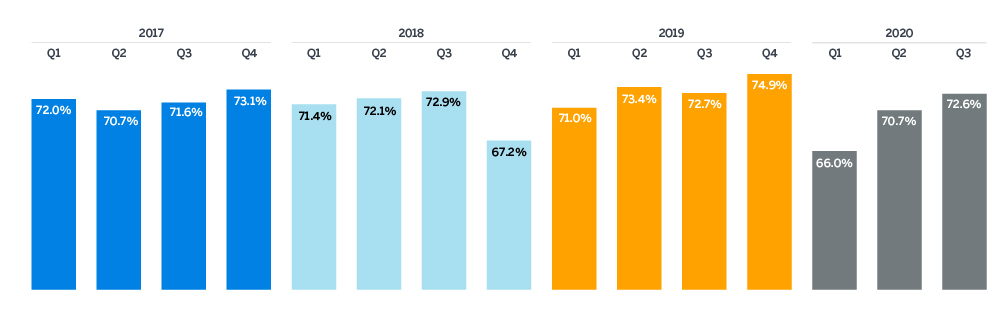
FIGURE 2: QUARTERLY INVESTMENT RETURNS
The total pension liability (TPL) continues to grow and stood at an estimated $5.472 trillion at the end of Q3 2020, up from $5.431 trillion at the end of Q2 2020. Just as pension assets grow over time with investment income and shrink over time as benefits are paid, so too does the TPL grow over time with interest and shrink as benefits are paid. The TPL also grows as active members accrue pension benefits.
FIGURE 3: QUARTERLY FUNDED STATUS
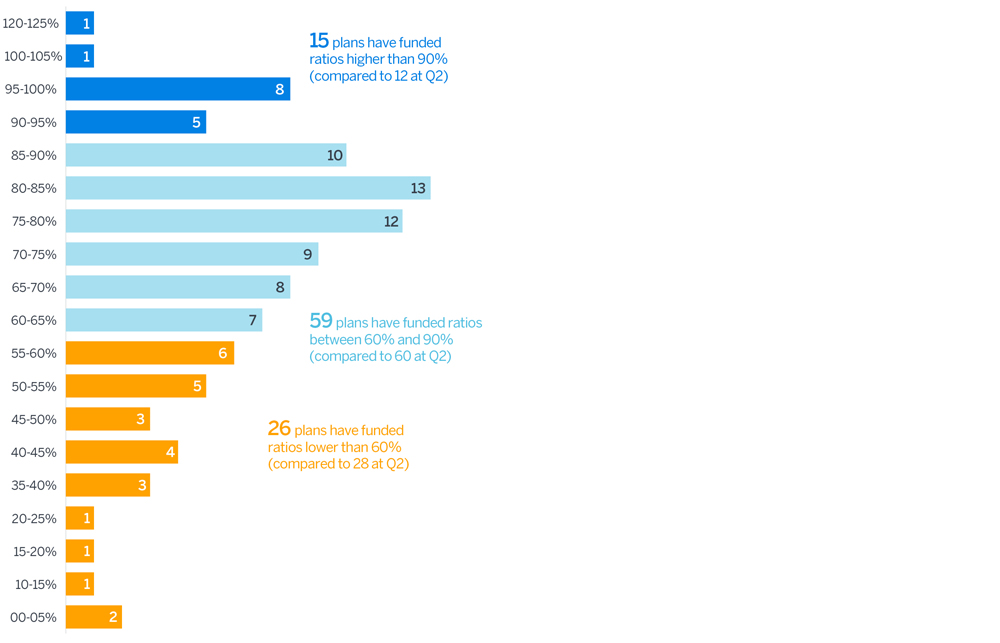
Funded ratios improved this quarter, with 15 plans above the 90% funded mark; 12 plans stood above this benchmark at the end of Q2 2020. Meanwhile, at the lower end of the spectrum, two plans moved above 60% funded, bringing the total number of plans under this mark to 26, down from 28 at Q2 2020.
FIGURE 4: FUNDED RATIOS AT SEPTEMBER 30, 2020
ABOUT THE MILLIMAN 100 PUBLIC PENSION FUNDING INDEX
Since 2012, Milliman has conducted an annual study of the 100 largest defined benefit plans sponsored by U.S. governments. The Milliman 100 Public Pension Funding Index projects the funded status for pension plans included in our study, reflecting the impact of actual market returns, utilizing the actual reported asset values, liabilities, and asset allocations of the pension plans.
The results of the Milliman 100 Public Pension Funding Index are based on the pension plan financial reporting information disclosed in the plan sponsors’ Comprehensive Annual Financial Reports, which reflect measurement dates ranging from June 30, 2017 to December 31, 2019. This information was summarized as part of the Milliman 2020 Public Pension Funding Study, which was published on December 3, 2020.
This quarterly update reflects adjustments made as of the end of June 2020 as part of Milliman’s annual Public Pension Funding Study, found here milliman.com/ppfs. The adjustments reflect updated publicly available asset and liability information gathered for the annual study.