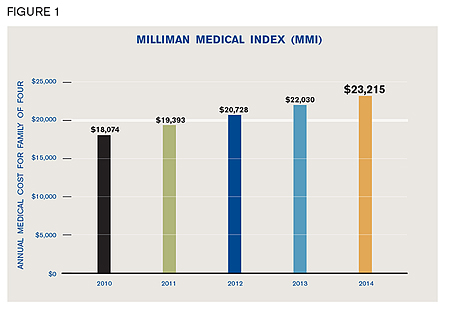
$23,215. That’s how much is spent in 2014 on healthcare for a typical American family of four covered by an average employer-sponsored health plan according to the 2014 Milliman Medical Index (MMI).1 And yet while the amount has more than doubled over the past 10 years, growing from $11,192 to $23,215, the 5.4% growth rate from 2013 to 2014 is the lowest annual change since the MMI was first calculated in 2002.

Employers pay the largest portion of healthcare costs, contributing $13,520 per year, or 58% of the total. However, increasing proportions of costs have been shifted to employees. Since 2007, when the economic recession began, the average cost to employers has increased 52%—an average of 6% per year—while the expenses borne by the family, through payroll deductions and out-of-pocket costs, have grown at an even faster rate, 73% (average of 8% per year).
Throughout this report we review the various components of the cost increases, how they are shared between employers and employees, and what key drivers are most likely to affect healthcare costs in 2014 and beyond.
Key findings
As measured by the 2014 MMI, the total annual cost of healthcare for a typical family of four covered by an employer-sponsored preferred provider plan (PPO) is $23,215 (see Figure 1). Key observations are:
- The MMI has more than doubled over the past 10 years (107% increase from 2004 to 2014), growing from $11,192 in 2004 to $23,215 in 2014.
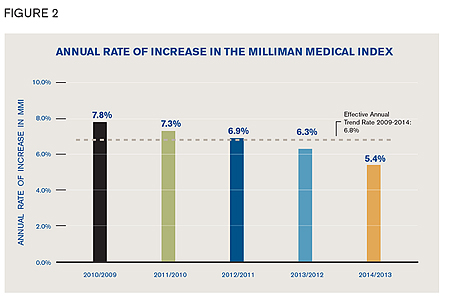
- Although healthcare costs continue to rise, the overall annual rate of increase in the cost of care for the family of four is at its lowest level since we first calculated the MMI in 2002. During those years, the annual increase in cost ranged from a high of 10.1%, in both 2003 and 2004, to a low of 5.4% in 2014. The rate of increase dropped by nearly a full percentage point, from 6.3% in 2013 to 5.4% in 2014. As discussed later in this report, this significant decline was likely due to a confluence of forces rather than any single event.
- In almost every year of the past 10, growth rates have decelerated. Figure 2 shows the most recent five years of that deceleration.
- In each of the past four years, employees have assumed an increasing percentage of the total cost of care. The total employee cost (payroll deductions plus out-of-pocket expenses) increased by approximately 32% from 2010 to 2014, while employer costs (premium contributions) increased by 26%.
Although the annual rate of increase is down, it is still well above the rate of growth in the consumer price index (CPI).2 However, when and how future annual rates of increase will continue to change is unclear, and may depend on a number of factors such as:

- The economy
- Supply and demand influences
- Healthcare provider engagement in cost control
- Specialty pharmacy
- Transparency
So far, the emerging reforms required by the Patient Protection and Affordable Care Act (ACA) have had little direct impact on the cost of care for our family of four in 2014 because this family tends to be insured through large group health plans. Some of the most far-reaching reforms are focused on access to insurance in the individual and small employer markets. Additionally, while the reforms are having immediate impacts on premium rates in those markets (the individual market, in particular), it is unclear whether they will ultimately have meaningful effects on growth in the cost of healthcare services.
Additional resources
1 The Milliman Medical Index is an actuarial analysis of the projected total cost of healthcare for a hypothetical family of four covered by an employer-sponsored preferred provider organization (PPO) plan. Unlike many other healthcare cost reports, the MMI measures the total cost of healthcare benefits, not just the employer’s share of the costs, and not just premiums. The MMI only includes healthcare costs. It does not include health plan administrative expenses or profit loads.
2 Over the 10-year period from 2004 through 2014, CPI has increased by approximately 2.3% per year, while the MMI has average annual increases of 7.6%.