The challenge
Due to the economic downturn of 2008 and subsequent period of decreasing interest rates, our not-for-profit client faced significant contribution increases to their defined benefit plan. The client took several actions to mitigate the effect of rising plan contributions, including closing the plan to new entrants in 2009 and electing permissible funding relief options during 2010 and 2011. They also elected the interest rate relief provided by the Moving Ahead for Progress in the 21st Century Act (MAP-21), which lowered the plan’s required contribution level in the short term. However, the plan’s long-term cost remained high and expected employer contributions were projected to increase significantly starting a few years from now as the effects of the MAP-21 relief began to phase out.
The client was faced with the challenge of reducing pension contribution volatility and investment risk. Their goals were to:
- Develop a lower-risk investment strategy that would continue to provide some excess returns to help reduce the funding deficit over time
- Reduce volatility of cash contributions
- Fund the present value of all future benefits (PVB) in seven years if cash is available, at which time the portfolio could be immunized with duration matched bond investments and no future contributions would be due
The solution
To assist the client in developing a long-term strategy to maintain a fully-funded plan at an acceptable risk tolerance level, Milliman completed a study examining expected funded levels and contribution requirements based on various asset allocation strategies using FutureCost, Milliman’s powerful stochastic asset/liability modeling tool.
The study utilized 1,000 stochastic projections of the growth in plan liabilities and assets over the next 10 years to estimate the plan’s funded status and minimum contribution requirements under the current asset allocation policy, and four sets of alternative asset allocations, as shown in Table 1.

The alternative asset allocations were intended to isolate the financial impact of (1) return-generating investments, which provide relatively high expected rates of return (but with high risk), and (2) liability-hedging investments, which can be used to hedge risk.
The following two funding contribution scenarios were produced under each asset allocation:
1. Contributing the minimum required amount
2. Contributing an accelerated annual amount that was expected to eliminate any unfunded PVB over seven years
Scenario 1: Contributing the minimum required amount
If the client contributed the minimum required amount each year and retained the current asset mix (55% equities and 45% fixed income), FutureCost projected the results shown in Figure 1.

- The median minimum required contributions for 2013 and 2014 were $3.1 million and $13.5 million, respectively.
- The median minimum required contributions increased significantly to about $30 million per year for years 2015-2017 (due to the phasing out of MAP-21 interest rate relief).
- The median minimum required contributions decreased to about $15 million per year for years 2018-2020 until the plan’s accrued benefits were fully funded.
- The plan’s funded percentage was expected to steadily decline from 96.6% in 2012 to 88.6% in 2016 and then steadily improve to 101.4% by 2020.
- The plan’s funded status was projected to be at its lowest point in 2016 due to the interest rate relief afforded by MAP-21 interest rates being fully phased out in this year.
- The plan would be expected to be fully funded on a PPA basis after seven years.
Scenario 2: Contributing Accelerated Amounts to Eliminate the Unfunded PVB
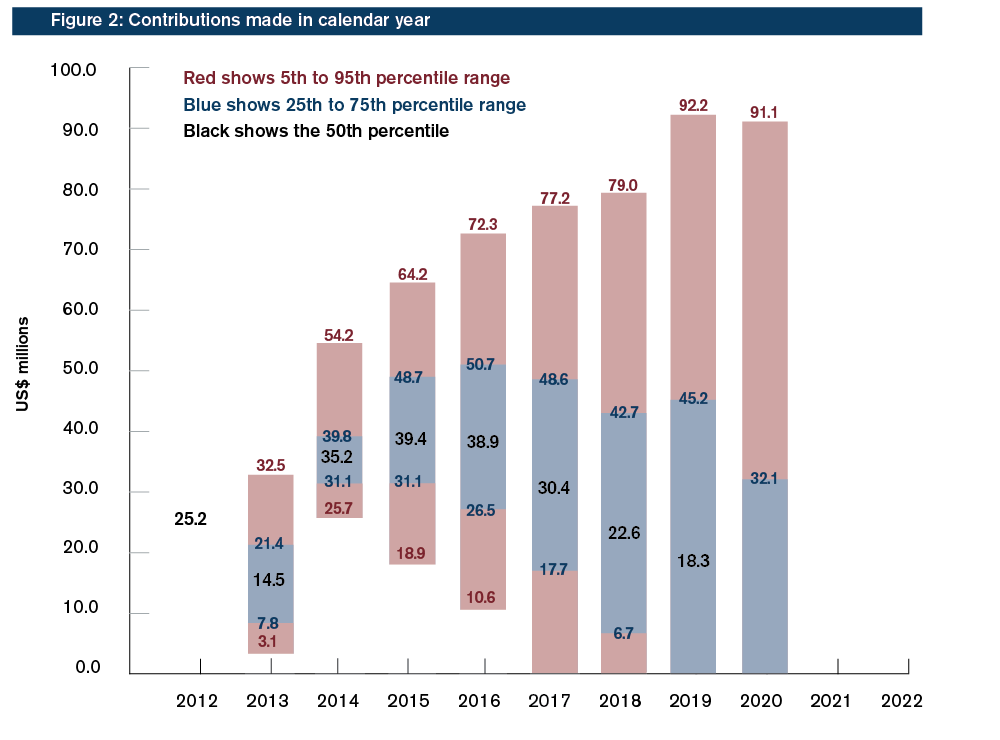
If the client made accelerated contributions each year to eliminate the unfunded PVB over seven years under the current asset mix (55% equities and 45% fixed income), FutureCost projected the results shown in Figure 2. The median annual contribution for 2013 was $14.5 million.

- The median annual contribution increased significantly per year for years 2014-2016 (due to using the full yield curve and funding to the PVB) and dropped to $30 million in 2017 and $18 to $23 million in years 2018 and 2019.
- The median annual contribution decreased to $0 starting in 2020 since the plan was fully funded by 2019.
- The plan’s funded percentage was expected to be above 90% for all years and then steadily improved to 100% by 2015 and 131.2% in 2022.
- The Plan would be expected to be fully funded on a PVB basis after seven years.
The scenarios utilizing the 55% equity/45% fixed income (current asset allocation) were the most volatile, resulting in the highest deviation of contribution levels, while the scenarios with lower equity exposure had the least contribution volatility. Immediately moving a larger percentage of the portfolio into fixed income would reduce risk exposure, but would also reduce return and increase contribution requirements under both scenarios.
The outcome
After reviewing the results in light of their financial goals and risk tolerance, the client decided to change the asset allocation from 55% equity/45% fixed income to Alternative 2 (40% equity/60% fixed income). Under this allocation, the 10-year expected annual return would decrease from 5.50% to 4.79% and the standard deviation would decrease from 10.02% to 7.74%. The cumulative contributions under the current asset mix and Alternative 2 were shown in Table 2 below. The client also plans to allocate more assets to fixed income as the plan’s funded status improves.

This new strategy will help the client continue capturing some asset returns during the current rising stock market by remaining 40% in equity and reduces the investment risk by holding 60% fixed income. It also allows excess returns to assist with funding the current shortfall and reduces contribution volatility. Even though the client decided not to fund the plan on a PVB basis at this time, they decided to fund the plan ignoring the MAP-21 relief and are scheduled to make cash contributions of about $23 million in 2013 despite the fact there was no required minimum contribution.
Milliman’s stochastic asset liability study provided the client the in-depth analysis they needed to develop a desirable funding and investment strategy for the future that fit their financial goals and risk tolerance.