Public pensions rebound in Q2 2020, reversing Q1 losses; assets gain $308 billion in market value, buoying funded ratio to 71.2%
Funded status improves by $200 billion in April 2020
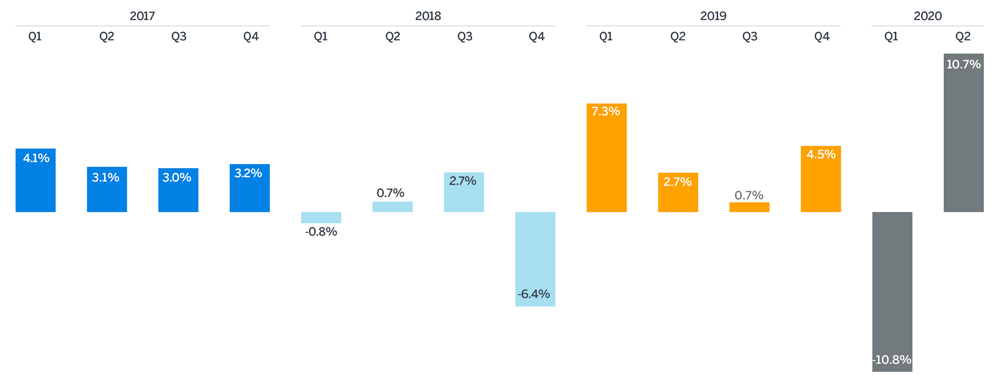
June saw continued recovery in the financial markets for the third straight month. For Q2 as a whole, public pension plans had investment returns of approximately 10.72%, nearly completing the recovery from the -10.81% suffered in Q1. The estimated funded status of the 100 largest U.S. public pension plans as measured by the Milliman 100 Public Pension Funding Index (PPFI) rebounded from 66.0% at the end of March 2020 to 71.2% at the end of June 2020. The deficit shrank to $1.554 trillion at the end of June 2020, down from $1.819 trillion at the end of March 2020. The funded status of the PPFI plans has improved dramatically over the past three months; however, the longerterm economic impact of COVID-19 on plan sponsors’ ability to fund public pensions remains uncertain.
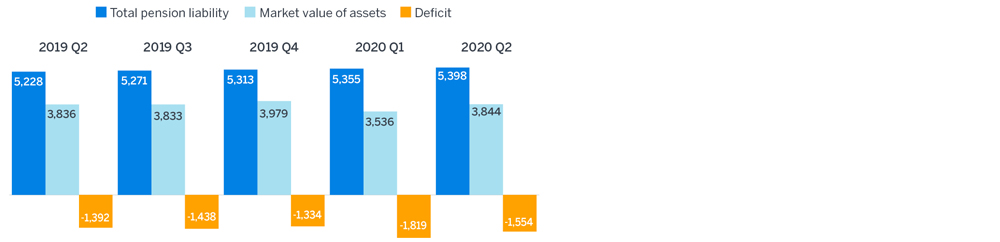
The Milliman 100 PPFI asset value increased from a PPFI low of $3.536 trillion at the end of Q1 2020 to $3.844 trillion at the end of Q2 2020. The plans gained market value of approximately $332 billion, which was offset by approximately $24 billion flowing out, as benefits paid out exceeded contributions coming in from employers and plan members.
While the Q2 rebound is very welcome news for plan sponsors, returns for the twelve months ending June 2020 averaged just 3.84%, markedly lower than plan sponsor reported funding interest rates as summarized in our 2019 Public Pension Funding Study. Almost 80% of the PPFI plans use a June 30 measurement date for financial reporting, and for this universe the 2019-20 year is likely to go into the books as a year of modest investment losses.
Figure 1: Funded ratio
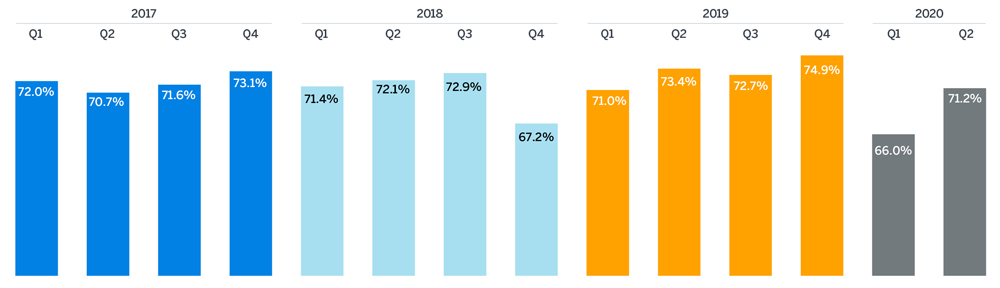
Figure 2: Quarterly investment returns
The total pension liability (TPL) continues to grow and stood at an estimated $5.398 trillion at the end of Q2 2020, up from $5.355 trillion at the end of Q1 2020. Just as pension assets grow over time with investment income and shrink over time as benefits are paid, so too does the TPL grow over time with interest and shrink as benefits are paid. The TPL also grows as active members accrue pension benefits.
Figure 3: Quarterly funded status
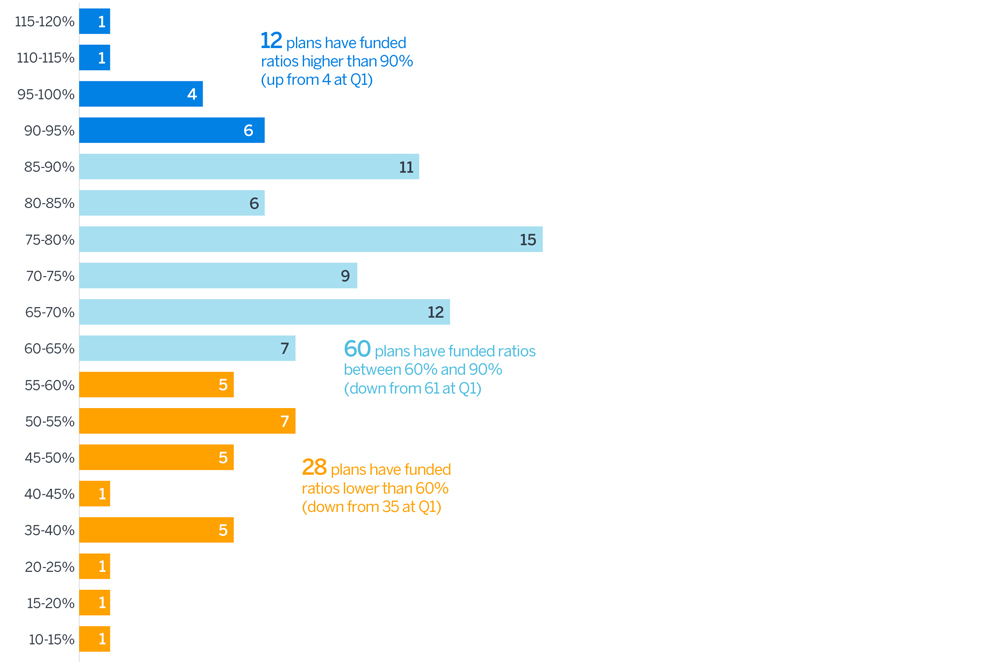
Funded ratios improved dramatically this quarter, with 12 plans above the 90% funded mark; just 4 plans stood above this benchmark at the end of Q1 2020. Meanwhile, at the lower end of the spectrum 7 plans moved above 60% funded, bringing the total number of plans under this mark to 28, down from 35 at Q1 2020.
Figure 4: Funded ratios at June 30, 2020
ABOUT THE MILLIMAN 100 PUBLIC PENSION FUNDING INDEX
Since 2012, Milliman has conducted an annual study of the 100 largest defined benefit plans sponsored by U.S. governments. The Milliman 100 Public Pension Funding Index projects the funded status for pension plans included in our study, reflecting the impact of actual market returns, utilizing the actual reported asset values, liabilities, and asset allocations of the pension plans.
The results of the Milliman 100 Public Pension Funding Index are based on the pension plan financial reporting information disclosed in the plan sponsors’ Comprehensive Annual Financial Reports, which reflect measurement dates ranging from June 30, 2016 to December 31, 2018. This information was summarized as part of the Milliman 2019 Public Pension Funding Study, which was published on January 20, 2020.
The projected asset and liability figures presented in this quarterly analysis will be adjusted as part of Milliman’s annual Public Pension Funding Study, due out later this summer.