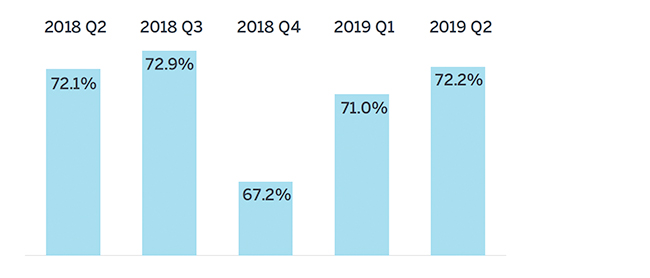
Public pension funded ratio improves to 72.2% in Q2 2019, up from 71.0%
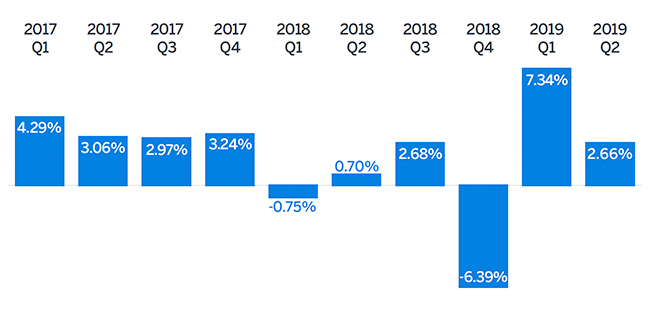
PPFI’s $50 billion funded status improvement paced by investment performance of 2.66%
The second quarter of 2019 continued the upward trend in asset returns for public pensions, with the estimated funded ratio of the 100 largest U.S. public pension plans as measured by the Milliman 100 Public Pension Funding Index (PPFI), growing from 71.0% at the end of March 2019 to 72.2% at the end of June 2019.
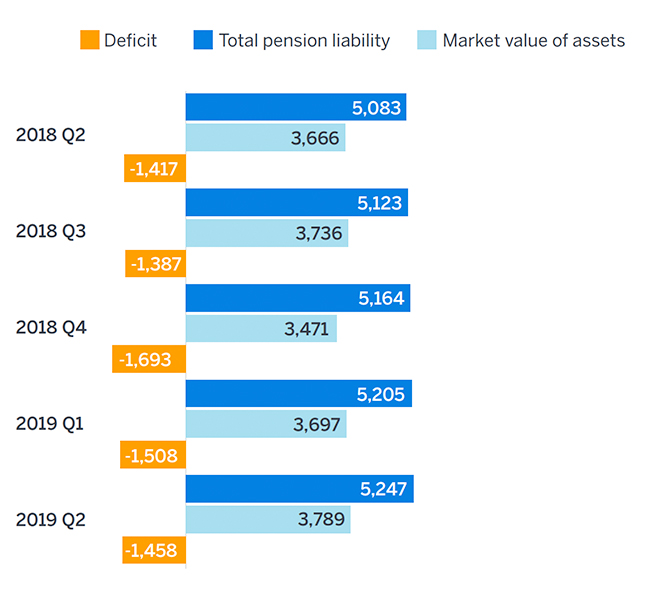
The deficit dropped to $1.458 trillion at the end of June 2019, down from $1.508 trillion at the end of March 2019. Plans have now recovered much of the investment losses they suffered in Q4 2018.
Funded ratio
In aggregate, the PPFI plans experienced an investment gain of 2.66% in Q2, with estimated returns ranging from 1.33% to 4.39%. The overall annualized return for the 12 months ending June 30, 2019, is slightly under 6.0%, falling short of the expected longterm earnings assumptions for the majority of the PPFI plans. The Milliman 100 PPFI asset value rose modestly from $3.697 trillion at the end of Q1 2019 to $3.789 trillion at the end of Q2 2019. The plans gained investment market value of approximately $119 billion, which was offset by approximately $27 billion flowing out, as benefits paid out exceeded contributions coming in from employers and plan members.
Quarterly investment returns
The total pension liability (TPL) continues to grow and stood at an estimated $5.247 trillion at the end of Q2 2019, up from $5.205 trillion at the end of Q1 2019. Just as pension assets grow over time with investment income and shrink over time as benefits are paid, so too does the TPL grow over time with interest and shrink as benefits are paid. The TPL also grows as active members accrue pension benefits.
Quarterly funded status
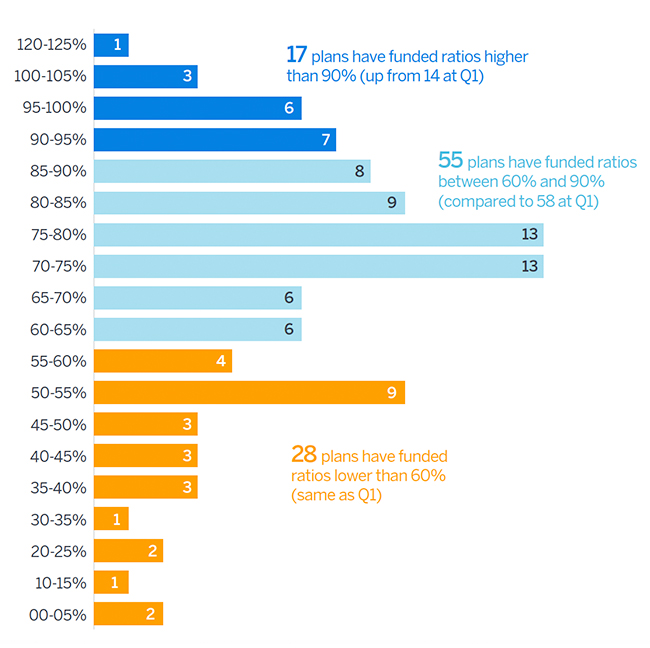
Funded ratios moved higher this quarter, with three plans moving back above the 90% funded mark; 17 plans currently stand above this benchmark, compared to 14 at the end of Q1 2019. At the lower end, the number of more poorly funded pension plans remained the same. There are 28 plans that have funded ratios below 60%, and nine plans remain below 40% funded.
Funded ratio at June 30, 2019
About the Milliman 100 Public Pension Funding Index
Since 2012, Milliman has conducted an annual study of the 100 largest defined benefit plans sponsored by U.S. governments. The Milliman 100 Public Pension Funding Index projects the funded status for pension plans included in our study, reflecting the impact of actual market returns, utilizing the actual reported asset values, liabilities, and asset allocations of the pension plans.
The results of the Milliman 100 Public Pension Funding Index are based on the pension plan financial reporting information disclosed in the plan sponsors’ Comprehensive Annual Financial Reports, which reflect measurement dates ranging from June 30, 2016 to December 31, 2017. This information was summarized as part of the Milliman 2018 Public Pension Funding Study, which was published on January 15, 2019.
This quarterly update reflects adjustments made as of the end of June 2018 as part of Milliman’s annual Public Pension Funding Study, just recently published, found here milliman.com/ppfs. The adjustments reflect updated publicly available asset and liability information gathered for the annual study.