Milliman analysis: Funded status worsens by $6 billion in June
The Milliman 100 PFI funded ratio decreased slightly, to 83.7%, as asset gains partially offset liability losses due to all-time low discount rate
The funded status of the 100 largest corporate defined benefit pension plans decreased by $6 billion during June as measured by the Milliman 100 Pension Funding Index (PFI). The deficit changed to $315 billion as a result of liability losses outweighing asset gains during June. Pension liabilities rose due to a decrease in the benchmark corporate bond interest rates used to value those liabilities. As of June 30, the funded ratio dropped to 83.7%, down from 83.8% at the end of May. The current funded ratio at mid-year trails the funded ratio of 89.8% seen at the start of 2020.
June’s solid 1.66% investment return raised the Milliman 100 PFI asset value by $22 billion to $1.623 trillion. By comparison, the 2020 Milliman Pension Funding Study reported that the monthly median expected investment return during 2019 was 0.53% (6.5% annualized). The full results of the annual 2020 study can be found at www.milliman.com/pfs. June’s above-average asset return caps a strong second quarter of returns, offsetting the PFI losses experienced during the first quarter of 2020.
Highlights
| $ BILLION | ||||
| MV | PBO | FUNDED STATUS | FUNDED PERCENTAGE | |
|---|---|---|---|---|
| MAY | 1,602 | 1,911 | (310) | 83.8% |
| JUNE | 1,623 | 1,938 | (315) | 83.7% |
| MONTHLY CHANGE | +22 | +27 | (6) | -0.1% |
| YTD CHANGE | +0 | +132 | (132) | -6.1% |
Note: Numbers may not add up precisely due to rounding
The projected benefit obligation (PBO) also rose during June, increasing the Milliman 100 PFI value to $1.938 trillion. The PBO increased because of an 11 basis point drop in the monthly discount rate, to 2.65% for June, from 2.76% in May. June’s discount rate marks the lowest observed in the 20-year history of the Milliman 100 PFI.
FIGURE 1: MILLIMAN 100 PENSION FUNDING INDEX PENSION SURPLUS/DEFICIT

FIGURE 2: MILLIMAN 100 PENSION FUNDING INDEX — PENSION FUNDED RATIO
Second Quarter 2020 Summary
For the quarter ending June 30, 2020, assets increased by $109 billion compared to plan liabilities, which increased by $181 billion. While investment returns exceeded expectations during the second quarter, discount rates, which fell by 74 basis points, had a much greater impact on funded status. The net result was a funded status worsening of $72 billion. The funded status deficit grew to $315 billion by the end of the second quarter. The funded ratio of the Milliman 100 companies decreased to 83.7% at the end of June from 86.2% at the end of March.
Over the last 12 months (July 2019 – June 2020), the cumulative asset return for these pensions has been 7.26% but the Milliman 100 PFI funded status deficit has worsened by $118 billion. The primary reason for the deterioration in the funded status deficit has been discount rate declines over the past 12 months. Discount rates have fallen precipitously from 3.45% as of June 30, 2019 to 2.65% a year later. The funded ratio of the Milliman 100 companies has decreased over the past 12 months to 83.7% from 88.8%.
2020-2021 Projections
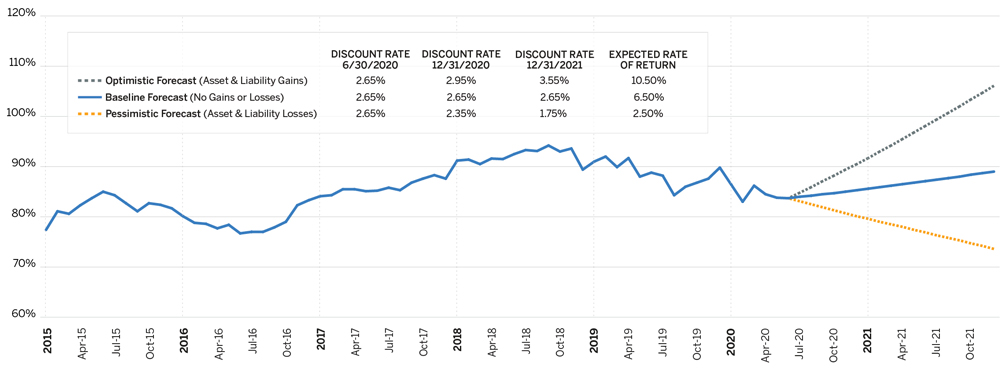
If the Milliman 100 PFI companies were to achieve the expected 6.5% median asset return (as per the 2020 pension funding study), and if the current discount rate of 2.65% were maintained during years 2020 through 2021, we forecast that the funded status of the surveyed plans would increase. This would result in a projected pension deficit of $284 billion (funded ratio of 85.3%) by the end of 2020 and a projected pension deficit of $211 billion (funded ratio of 89.0%) by the end of 2021. For purposes of this forecast, we have assumed 2020 and 2021 aggregate annual contributions of $40 billion and $50 billion, respectively.
Under an optimistic forecast with rising interest rates (reaching 2.95% by the end of 2020 and 3.55% by the end of 2021) and asset gains (10.5% annual returns), the funded ratio would climb to 91% by the end of 2020 and 106% by the end of 2021. Under a pessimistic forecast with similar interest rate and asset movements (2.35% discount rate at the end of 2020 and 1.75% by the end of 2021 and 2.5% annual returns), the funded ratio would decline to 80% by the end of 2020 and 74% by the end of 2021.
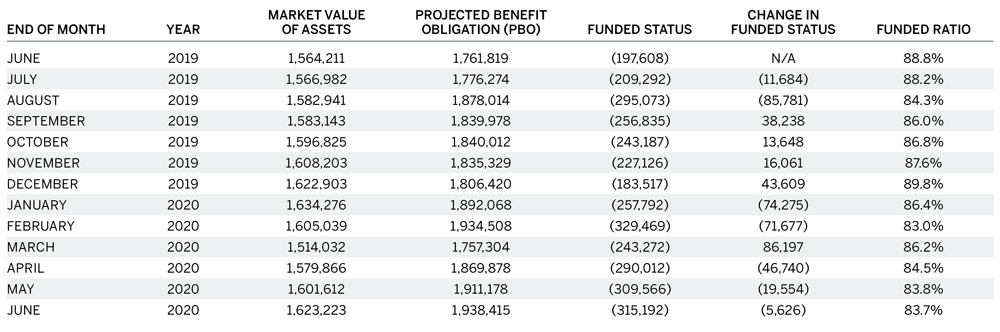
MILLIMAN 100 PENSION FUNDING INDEX — JUNE 2020 (ALL DOLLAR AMOUNTS IN MILLIONS)
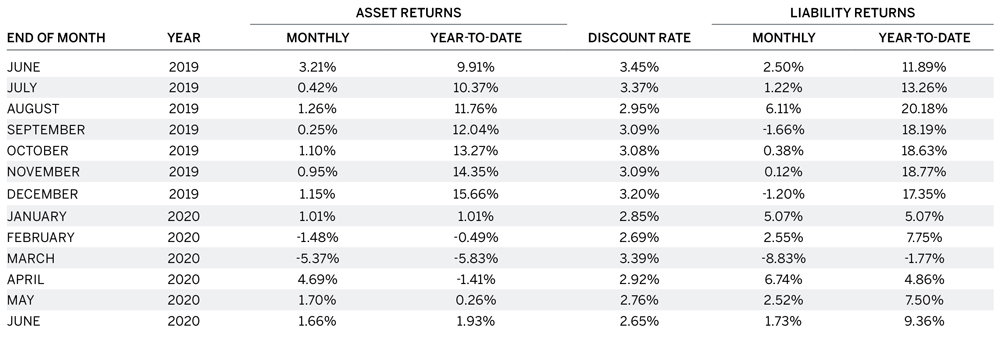
PENSION ASSET AND LIABILITY RETURNS
About the Milliman 100 Monthly Pension Funding Index
For the past 20 years, Milliman has conducted an annual study of the 100 largest defined benefit pension plans sponsored by U.S. public companies. The Milliman 100 Pension Funding Index projects the funded status for pension plans included in our study, reflecting the impact of market returns and interest rate changes on pension funded status, utilizing the actual reported asset values, liabilities, and asset allocations of the companies’ pension plans.
The results of the Milliman 100 Pension Funding Index were based on the actual pension plan accounting information disclosed in the footnotes to the companies’ annual reports for the 2019 fiscal year and for previous fiscal years. This pension plan accounting disclosure information was summarized as part of the Milliman 2020 Pension Funding Study, which was published on April 28, 2020. In addition to providing the financial information on the funded status of U.S. qualified pension plans, the footnotes may also include figures for the companies’ nonqualified and foreign plans, both of which are often unfunded or subject to different funding standards than those for U.S. qualified pension plans. They do not represent the funded status of the companies’ U.S. qualified pension plans under ERISA.