Provider groups across the country are negotiating contracts with commercial payers with increasing levels of financial risk as part of the arrangements. Many provider groups aren’t yet armed with the tools, analyses, market information, and data insights that insurers typically have at their disposal, putting them at a disadvantage. To ensure that these contracts are sustainable and fair, it’s important for providers to invest in leveling the playing field.
There is great opportunity for creating win-win partnerships with carefully structured provider risk-sharing arrangements that still align incentives to bring down costs and improve patient care. The real problem is that information asymmetry in these negotiations can undermine a provider's position and result in a disadvantageous agreement.
Providers need to be prepared with information and analyses that will put them on equal footing with insurers. It is all too easy to inadvertently be on shaky ground in negotiations with simple analyses or by assuming too much. In this paper, we outline the four key negotiating strengths that allow a provider organization to create a favorable risk-sharing arrangement.
1. Know your costs
2. Understand sources of volatility and variation
3. Negotiate a reimbursement structure that works
4. Ensure health plan compatibility
1. Know your costs
|
Shaky ground
|
|
On equal footing
|
Arming yourself with as much information as possible about your own financial standing is the first step in a successful negotiation. We’re not talking about pulling your budgets and accounts—we’re talking about a deep, retrospective benchmarking analysis to understand where your costs are occurring on cohort- and procedure-level bases. Annual budgets and even detailed practice expense reports are often a poor basis for comparison when seeking to understand how a risk-sharing arrangement will affect future practice finances. Breaking down costs—both current and optimized—by detailed category provides the apples-to-apples basis needed to evaluate a risk arrangement.
Often, the data needed for such an analysis is not readily available to a provider group. While it’s important to develop a data warehouse containing all necessary metrics, market benchmarks and other external sources may be used to set initial assumptions where internal data lack credibility. For example, it can be valuable to discuss processes with main line and senior leadership staff– often this is the best way to gain critical insights that may not be evident in data metrics.
What does this analysis look like? Benchmarking reports ought to go beyond basic cost-per-service and utilization metrics, uncovering important sources of cost variation in the practice or population.
The detailed table in Figure 4, located in Appendix A displays a simplified example of how current and optimized practice costs might be compared with a proposed risk target. Several metrics are shown by service category (as indicated in column (1) of the table), including the average staff cost in column (2), the average supply cost in column (3), and the average administrative cost per service in column (4), as well as utilization per 1,000 patients in column (5) and total per member per month (PMPM) costs shown in column (6). In Figure 4 in the appendix, we see that, in the current situation, the provider costs, $25.23 PMPM, shown in column (6), are higher than the proposed risk target, $24.20 PMPM, shown in column (7), and thus a risk-sharing arrangement based on this target would negatively affect the provider. However, further inspection reveals:
- Comparing with the optimized approach in column (5), there is an opportunity for utilization reduction for all services except Service 1, because the optimized approach for it is lower than the current situation.
- For Service 4, there is opportunity to shift utilization from physicians to physician assistants and registered nurses, resulting in a reduction in overall costs.
- Administrative cost per service will increase across the board, seen in column (4), which is due to an increase in administrative and medical management activities required to manage the risk contract.
In this example, the benchmarking approach reveals that savings are possible, but only after targeted actions are taken. When defining service categories for this analysis, it’s important to use the greatest level of detail possible and all factors that may affect the final cost should be taken into account. In addition to the ones presented in Figure 4 in the appendix, relevant factors could include administrative changes, changes in patient utilization that are due to plan cost sharing, etc.
To make the benchmarking model even more finely tuned for a risk-sharing arrangement, the following enhancements may be added:
- Detail by population cohort, which allows for identification of high- and low-cost groups that may need to be treated differently
- Cost trend to adjust for the increase in costs over time
- Anticipate changes in the future risk contract benchmarks to ensure consistency in projections
A prospective component can be added to model future costs and the impact of the new contract. As a result, this type of modeling can uncover any red flags, increase chances of success, and help you make an informed decision.
2. Understand sources of volatility and variation
It is expected that a risk-based contract will reward provider groups for activities that improve patient wellness. There are, however, a number of financial risks that providers cannot reasonably control. Understanding these sources of volatility and variation is key to negotiating a contract that protects against these types of risks.
Are your demographics properly reflected?
Demographics make a big difference in risk-based contracting arrangements. Why?
- Not just the total costs but also the mix of costs by service type vary dramatically by age and gender. Any risk targets need to reflect this.
- Your providers’ ability to treat individuals may vary by patient cohort. For instance, one practice may be optimized for older patients with multiple chronic conditions, while another is best at treating women of childbearing age.
Gathering information about the members under the risk-sharing agreement is critical to making accurate forecasts of overall utilization and costs. This helps you, as a provider, to make informed decisions on how to lower costs and increase the quality of care. Understanding changes in demographics and your abilities to manage utilization and costs allows you to set more accurate contract parameters, such as capitation rates or care management targets.
What are some aspects of your members’ demographics that would lead to higher costs or higher utilization? How about the members you may gain or lose from entering the risk-sharing arrangement or the changes in demographics that you may experience? When reviewing an insured population, health plans often ask key questions such as:
- What is the availability of care to the average member?
- How concentrated is the population?
- What is the age distribution of the population?
- What does the benefit plan look like for this population?
The table in Figure 1 is a simple example of the variance in claims expense by age within a sample population. You can see that, as an individual ages, average annual claims expense also rises. An older than average population will likely lead to increased utilization and higher costs.
Figure 1: Probability of high claims by age (sample population)
| Age category | % of individuals with annual claims in excess of $15,000 |
| <18 | 1.75% |
| 18 - 24 | 3.82% |
| 25 - 29 | 5.76% |
| 30 - 34 | 7.16% |
| 35 - 39 | 6.71% |
| 40 - 44 | 6.17% |
| 45 - 49 | 6.66% |
| 50 - 54 | 7.83% |
| 55 - 59 | 9.22% |
| 60 - 64 | 11.32% |
When asked to manage an attributed population, it may not be realistic to assume that all members will utilize the provider network. Can your provider system support all the new members or will they be free to shift out of network to get access to care? Monitoring both in and out-of-network utilization and costs can provide additional insight. What new responsibilities or services do you have with this increased population? Quantifying the changes allows for more accurate projections of outcomes.
A properly structured cost benchmark should be adjusted for demographics with possible structuring of stop-loss or higher minimum pool sizes for populations with more volatile claims.
Mitigate morbidity risk
|
Shaky ground
|
|
On equal footing
|
Although great care can be taken to calibrate contracts to the current population demographic mix, risk mitigation does not stop there. Contractual provisions that adjust for population morbidity (health status) measures provide financial protections against changes in the underlying population morbidity, and furthermore can be structured to mitigate overall volatility risk.
Risk adjustment is a helpful tool to calibrate actual costs to adjust for an underlying population’s health status. Risk adjustment is a well-proven approach to measure and therefore adjust out the impact that differences in health status have on results to ensure an apples-to-apples comparison. The graph in Figure 2 illustrates how risk-adjusting costs can significantly reduce the level of uncontrolled variation in provider compensation. In this example, which is normalized using the Milliman Advanced Risk Adjusters™ (MARA™) tool, risk adjustment to ensure health status is considered. The gray line represents the distribution in total PMPM costs for patient panels of 200 members. Application of risk adjustment to the actual costs, shown by the blue line, significantly reduces the variation of the cost distribution by removing distortion from differences in health status.
- Prior to the application of risk adjustment, only 18% of members fall within +/- $20 (5.6%) of the benchmark cost.
- After the application of risk adjustment, 33% of members fall within +/- $20 (5.6%) of the benchmark cost.
Variation in average costs decreases with panel size. However, benchmark improvement is still observed for a panel size of 10,000+ members.1
Figure 2: Probability distribution of group costs with and without risk adjustment

Modeling expected variation in costs (for a given panel size) against target or benchmark costs also yields the following benefits:
- This approach provides the opportunity to identify the magnitude of risk in the contract after risk adjustment is incorporated, and allows the provider group to decide on the best course of action. They may include limiting provider exposure to high costs (e.g., with stop-loss insurance or removing some members or services from the contract) or entering into upside-only contracts (or contracts with limited downside risk) with small groups.
- Most risk contracts are variations on either one- or two-sided risk corridor models, which allow both parties to share in agreed-upon portions of risk, depending on how far away the experience is from priced rates. Modeling the payment probability distribution provides the opportunity to test the expected financial outcomes for a variety of potential contracts and quantify financial vulnerabilities.
After entering a risk-sharing arrangement, health insurers are likely to request periodic data to determine whether or not program implementation is going according to plan. Providers should do the same, reviewing data monthly or quarterly to measure progress.
Often, there is uncertainty associated with setting rates for the first time. A slight underestimation in projected claims costs may lead to significant losses during the first few time periods of the contract. Consequently, it is a good idea to consider protection against losses at the very start. One method employed in Medicaid capitation contracts (and many commercial risk-sharing agreements) is the use of risk corridors during the first few years of program implementation. In this arrangement, both the payer and provider share in profits or losses around the target rate, with the aim of producing more stable results for both parties. Using this approach, the estimated impact of risk corridors may be modeled. However, it should also be noted that the use of risk corridors in risk-sharing agreements may not be appropriate in all situations. Risk corridors may limit a provider's ability to achieve shared savings for small, incremental improvements that fall within the corridor year after year. It is important that a provider group understand and carefully weigh the pros and cons of risk corridors before entering into a risk-sharing arrangement.
3. Negotiate a reimbursement structure that works
Attribution
|
Shaky ground
|
|
On equal footing
|
Attribution is the assignment of specific covered members to specific providers for financial risk-sharing purposes.
Previously, we discussed a scenario where a member population might not use the provider group for all services because of access issues. While understanding which services providers in your network can perform is important, it is also crucial to quantify the services that cannot be covered in-network. Who, then, is responsible for out-of-network coverage? What percentage of the population utilizes services outside of the network? How does this affect your ability to manage care? These types of questions are important to think about in regard to understanding how risks are attributed among providers, and therefore should be incorporated into the method used to assign members to specific providers for risk contracts.
Attribution methods contribute to the risks involved when trying to manage a population. For example, a provider may inadvertently take on more risk than expected if an attributed member chooses to use other providers throughout the year. It may be possible to reduce these risks by agreeing to a tiered reimbursement approach, based on how much of the utilization goes through the provider system. In addition, the type of attribution used within the health system itself can help manage incentives for different providers. Because there is usually too much variation in costs when using attribution on the level of a single physician or small practice, we advise against using it as the sole basis for that specific provider’s reimbursement. We have defined common types of attribution of patients within a health system below:
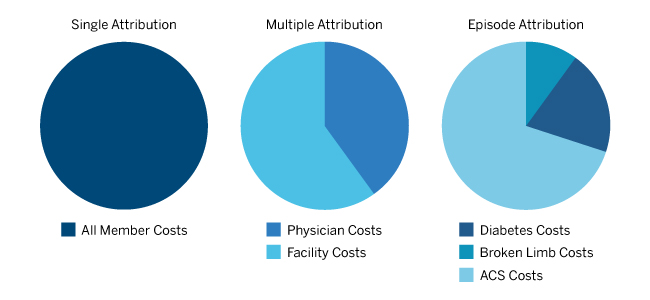
- Single attribution occurs when all member costs are assigned to one provider group. This approach may make it simpler to determine who is responsible for managing a patient and provide a straightforward shared savings approach. This approach can also be easier to administer because providers within the group are responsible for the entire care regimen of a patient.
- Multiple attribution assumes each relevant provider group (physicians in relevant specialty groupings, facilities, etc.) is responsible for its share of costs incurred by the member. This type of attribution may make it most efficient to manage care by assigning portions of care to corresponding provider- or facility-based groups. However, it would be more difficult to implement, track, and operate.
- Episode-based attribution assigns an episode of care to a specific provider grouping or a facility. An episode of care consists of all costs related to a specific incident, such as a broken limb or a heart attack. This type of attribution is more difficult to track and administer, but provides more information about care management. A well-known example of this is bundled payments.
The chart in Figure 3 provides a visual of the various types of attribution. It’s best to go into a risk-sharing arrangement with a well-described attribution process that fits your needs.
Figure 3: Attribution types
Reimbursement structure
|
Shaky ground
|
|
On equal footing
|
To determine the proper reimbursement structure, think about what your goals are for the arrangement as well as what the health plan’s goals are for contracting with you. Do you provide a unique set of services that the health plan needs? Does the insurer want to grow its membership base, reduce rates, or target a new geographic area or employer? Understanding how your goals align will allow you to pick an arrangement that best suits both parties. For example, private label arrangements are emerging in provider/payer relations, which allow the provider group’s name to be part of the insurance product name for marketing purposes. In addition, such plans allow for shared savings and can be geographically well defined.
Take time to identify the different risks you are accepting and verify that you can manage them. Potential risks include:
- Morbidity risk: Control through age/sex and risk-adjusted capitation rates.
- Low member count volatility: Don’t take downside risk until a predefined member threshold is met.
- Decreasing care management targets: Add a provision to the contract to keep targets stable and model future costs to determine the correct initial target level.
- Attribution risk: Ensure that you have a solid contract in place before entering risk-sharing arrangements, where service “leakage” is possible.
- Catastrophic claims risk: Offload through reinsurance.
- Rate insufficiency: A detailed projection of expected costs is the best protection. Low coinsurance levels for shared savings/losses in the first year can lessen risk to the provider while both parties are adapting to shared savings.
Depending on the types of providers contracted with, various types of reimbursement may be necessary. For example, hospital and outpatient providers are best poised to take advantage of bundled payment arrangements, whereas capitation and care coordination fees can more readily be used by physicians.
All provider types can make use of performance incentives in the reimbursement structure, so it’s important to understand how quality measures will be incorporated into reimbursement, and understand how meeting targets may affect long-term contracting. If you meet your benchmark in the first year, how will this affect the future? Will you be held to a higher quality benchmark in Year 3?
4. Ensure health plan compatibility
|
Shaky ground
|
|
On equal footing
|
In general, it’s crucial to find out all information possible about your contracting partner. Before entering into risk-sharing arrangements, health plans will likely complete similar analyses to the methods described above and prepare well for negotiations. Providers should do the same. It’s important to understand the strategic plans of health insurers and ask questions that would help define your expected role in new arrangements, such as:
- Are they trying to construct narrow networks? What tiers would you be in? How will this affect your volume?
- How dominant are the insurers in the area?
- Would you be a key part of their networks? Would your presence in a network affect an insurer’s ability to get business?
Compatibility checks
Operational
- What is the current contracted provider scope of the health plan?
- Who is the claims administrator? How quickly can claims be paid?
- What are some key employer groups in your region that the health plan covers?
Ethical
- Are the insurer's values consistent with its actions?
- What is the overall review of the plan?
Financial
- How financially stable is the plan?
- Does the health plan have enough capital to pay all obligations?
Answers to these questions not only identify leverage, but also help frame the overall compatibility with the health plan. Also try to identify operational, ethical, and financial compatibilities.
A contract should be signed only if your incentives align with the health plan and the insurer is deemed compatible with the provider group.
Conclusion
While it’s becoming more and more common for provider groups to take on risk in provider/payer relationships, there remain many potential pitfalls for providers when entering into such arrangements. Many of the processes described above were initially developed by actuaries to aid insurers and are easily adapted to be relevant for providers. Determining health plan compatibility, exploring the demographics of all affected members, and developing benchmarking models and solid attribution processes are all crucial for establishing mutually beneficial relationships with insurers. Furthermore, taking extra care to develop a reimbursement structure that includes risk mitigation provisions in the contract can protect the provider group from unpredicted risks and provide financial reward in managing patient care.
Colleen Norris is a consulting actuary with the Denver office of Milliman. Contact Colleen at [email protected] or at 303.672.9059.
Tatyana Malinina is an actuarial assistant with the Denver office of Milliman. Contact Tatyana at [email protected] or at 303.672.9051.
The materials in this document represent the opinion of the authors and are not representative of the views of Milliman, Inc. Milliman does not certify the information, nor does it guarantee the accuracy and completeness of such information. Use of such information is voluntary and should not be relied upon unless an independent review of its accuracy and completeness has been performed. Materials may not be reproduced without the express consent of Milliman.
Guidelines issued by the American Academy of Actuaries require actuaries to include their professional qualifications in actuarial communications. The authors are members of the American Academy of Actuaries and meet the qualification standards for performing the analyses in this report.
1For panels of 10,000 members, the variance of total costs is reduced by 40% after the application of MARA risk adjustment.
Appendix A
Figure 4: Sample benchmarking approaches
| Current situation | |||||
|
Service category (1) |
Average staff cost (2) |
Average supply cost (3) |
Average admin. cost (4) |
Util. per 1,000 per month (5) |
Total PMPM (6) = ((2)+(3)+(4))*(5)/1000 |
| Service 1 | $326.58 | $23.56 | $19.84 | 6.4 | $2.37 |
| Service 2 | $404.22 | $7.69 | $19.50 | 8.7 | $3.75 |
| Service 3 | $92.60 | $14.90 | $9.77 | 16.6 | $1.95 |
| Service 4 | $224.01 | $5.60 | $12.52 | 25.4 | $6.15 |
| Physician | $308.20 | $4.76 | $11.83 | 11.2 | $3.64 |
| Physician assistant | $210.15 | $6.21 | $13.20 | 9.0 | $2.07 |
| Registered Nurse | $165.30 | $6.29 | $12.50 | 4.0 | $0.74 |
| Certified Nursing Assistant | $46.23 | $5.76 | $13.28 | 1.2 | $0.08 |
| Service 5 | $389.45 | $16.49 | $12.94 | 26.3 | $11.02 |
| Total PMPM | $25.23 | ||||
| Optimized approach | |||||
|
Service category (1) |
Average staff cost (2) |
Average supply cost (3) |
Average admin. cost (4) |
Util. per 1,000 per month (5) |
Total PMPM (6) = ((2)+(3)+(4))*(5)/1000 |
| Service 1 | $320.00 | $23.56 | $21.82 | 6.8 | $2.48 |
| Service 2 | $400.00 | $7.69 | $21.45 | 8.1 | $3.48 |
| Service 3 | $92.60 | $14.90 | $10.75 | 14.0 | $1.65 |
| Service 4 | $209.25 | $5.82 | $13.96 | 25.2 | $5.77 |
| Physician | $310.00 | $4.76 | $13.01 | 7.0 | $2.29 |
| Physician assistant | $215.00 | $6.21 | $14.52 | 12.0 | $2.83 |
| Registered Nurse | $165.00 | $6.29 | $13.75 | 5.0 | $0.93 |
| Certified Nursing Assistant | $45.00 | $5.76 | $14.61 | 1.2 | $0.08 |
| Service 5 | $350.00 | $15.00 | $14.23 | 25.0 | $9.48 |
| Total PMPM | $22.86 | ||||