Commentary
In the life of the U.S. economy and its financial markets, 2019 was in many ways an exceptional year. The S&P 500 returned 31.5%, its second best return of the last 20 years.
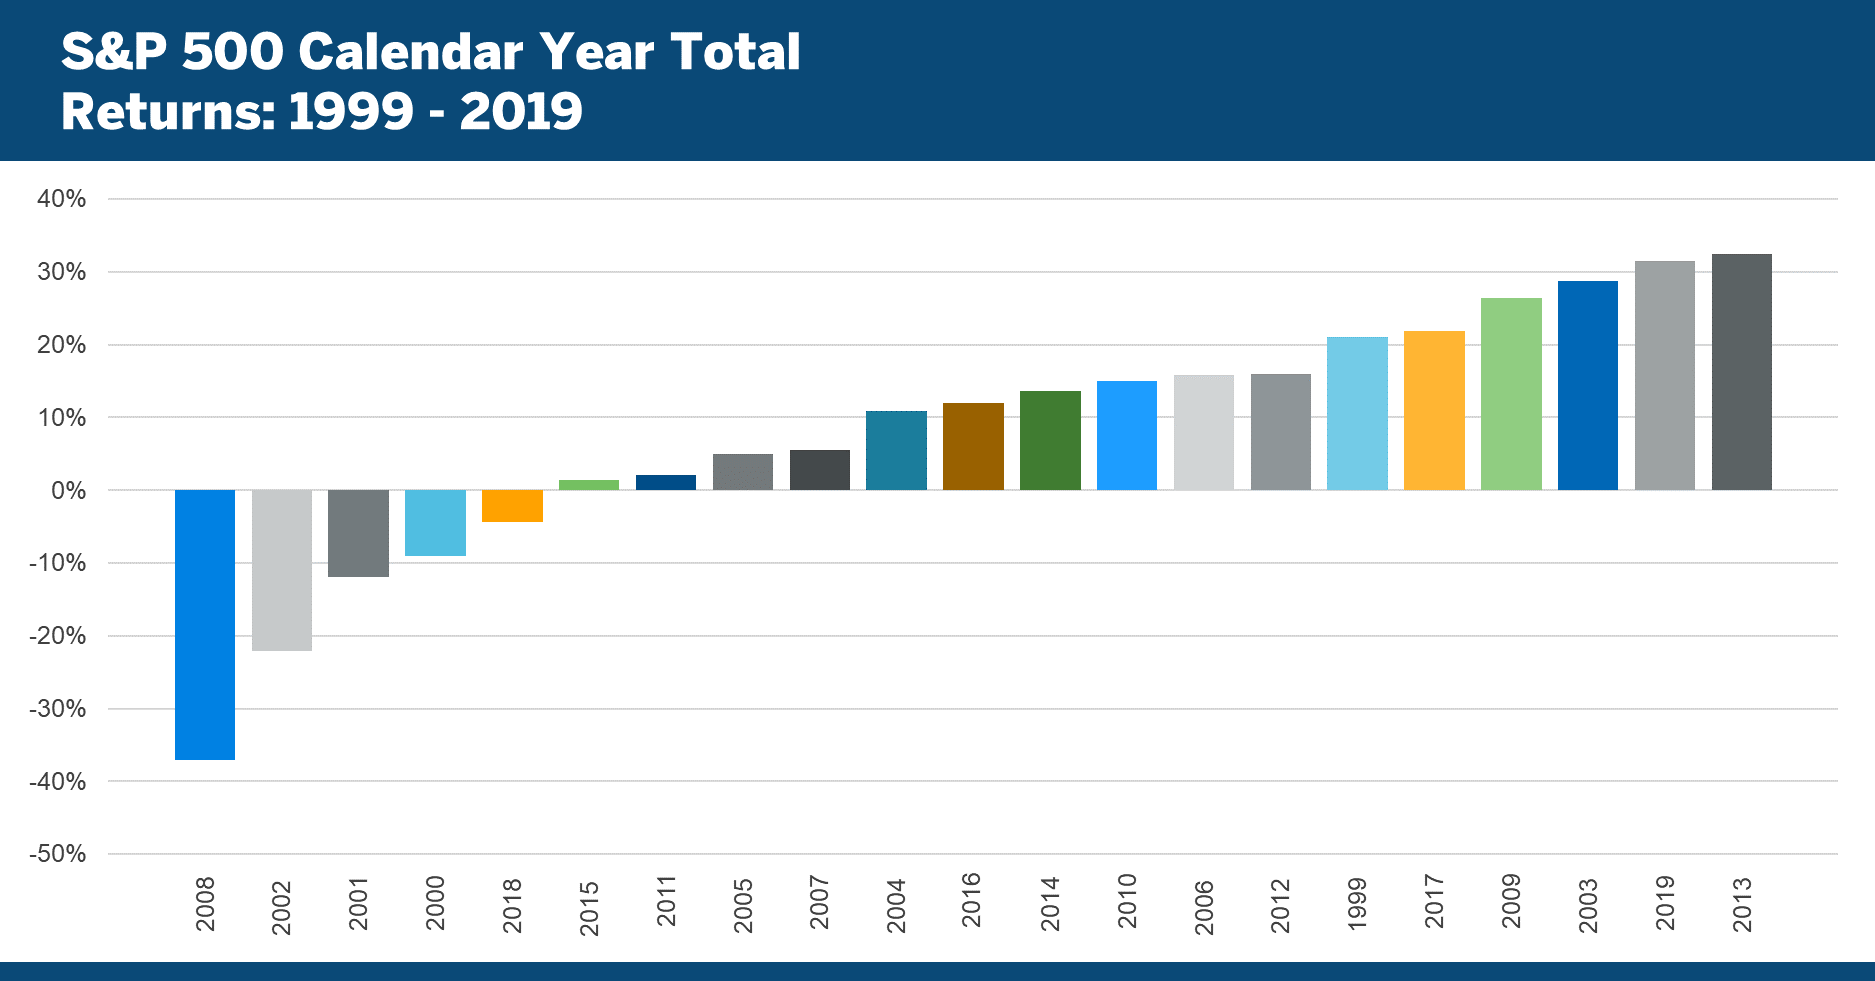
At the same time, the Bloomberg Barclays US Agg Bond Index returned 8.7%, its best return since 2002. The sum of the two returns (40.2%) hasn’t been this high since 1997 (43.0%), when the S&P 500 returned 37.6% and the US Agg returned 9.7%.
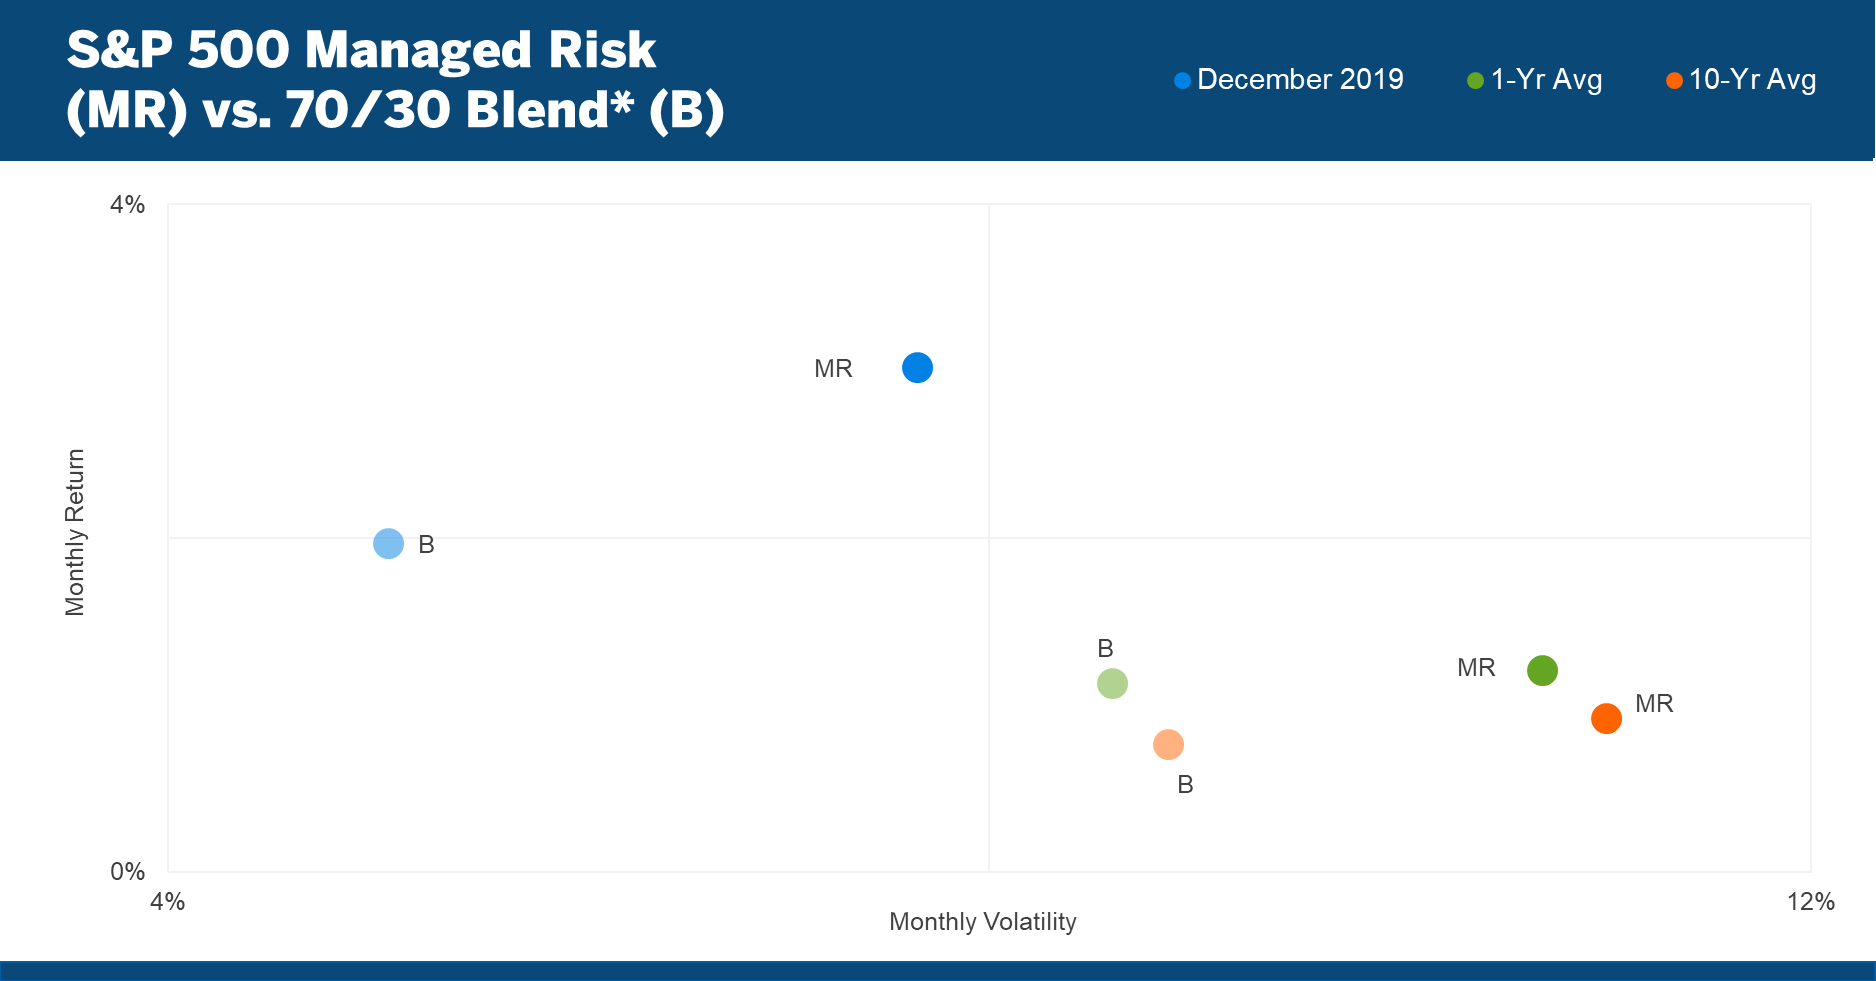
These strong returns notwithstanding, the S&P 500 Managed Risk Index, which allocates to cash to stay below its 18% volatility threshold, essentially matched the 2019 return of a 70/30 stock/bond blend.. [1]
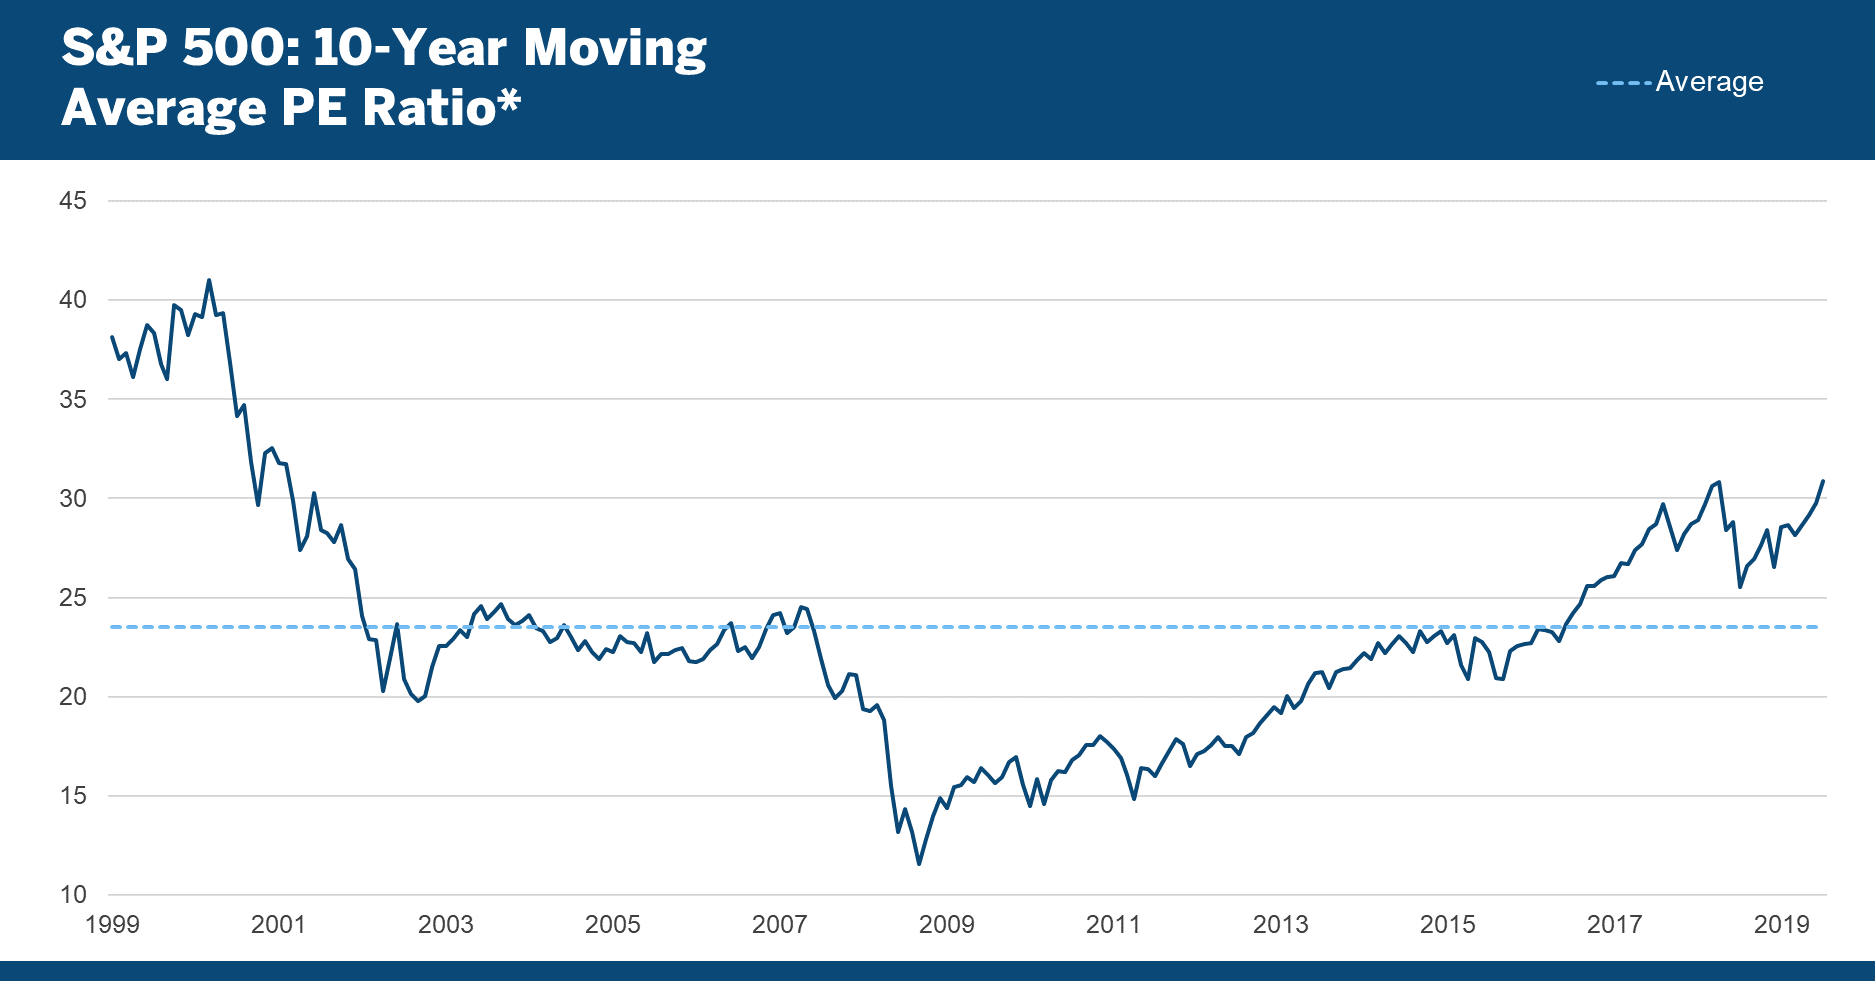
The S&P 500’s increase was solely on the wings of PE expansion; data from Bloomberg indicate that trailing 12 month earnings per share as of year-end is actually slightly lower than a year earlier. The 10-year moving average PE ratio for US large cap stocks climbed five points in 2019, from 25.5 to 30.9, ending the year at their highest level since August 2001:
Adding bonds into the mix reflects an even more extreme indication of valuations in US capital markets. The following chart depicts the market cap of the Russell 3000 plus the market value of the ICE BofA US Corporate, Government & Mortgage Index, High Yield Index and Municipal Securities Index.
In 2019 alone, the measure climbed 35 percentage points, from 243% to 278%:
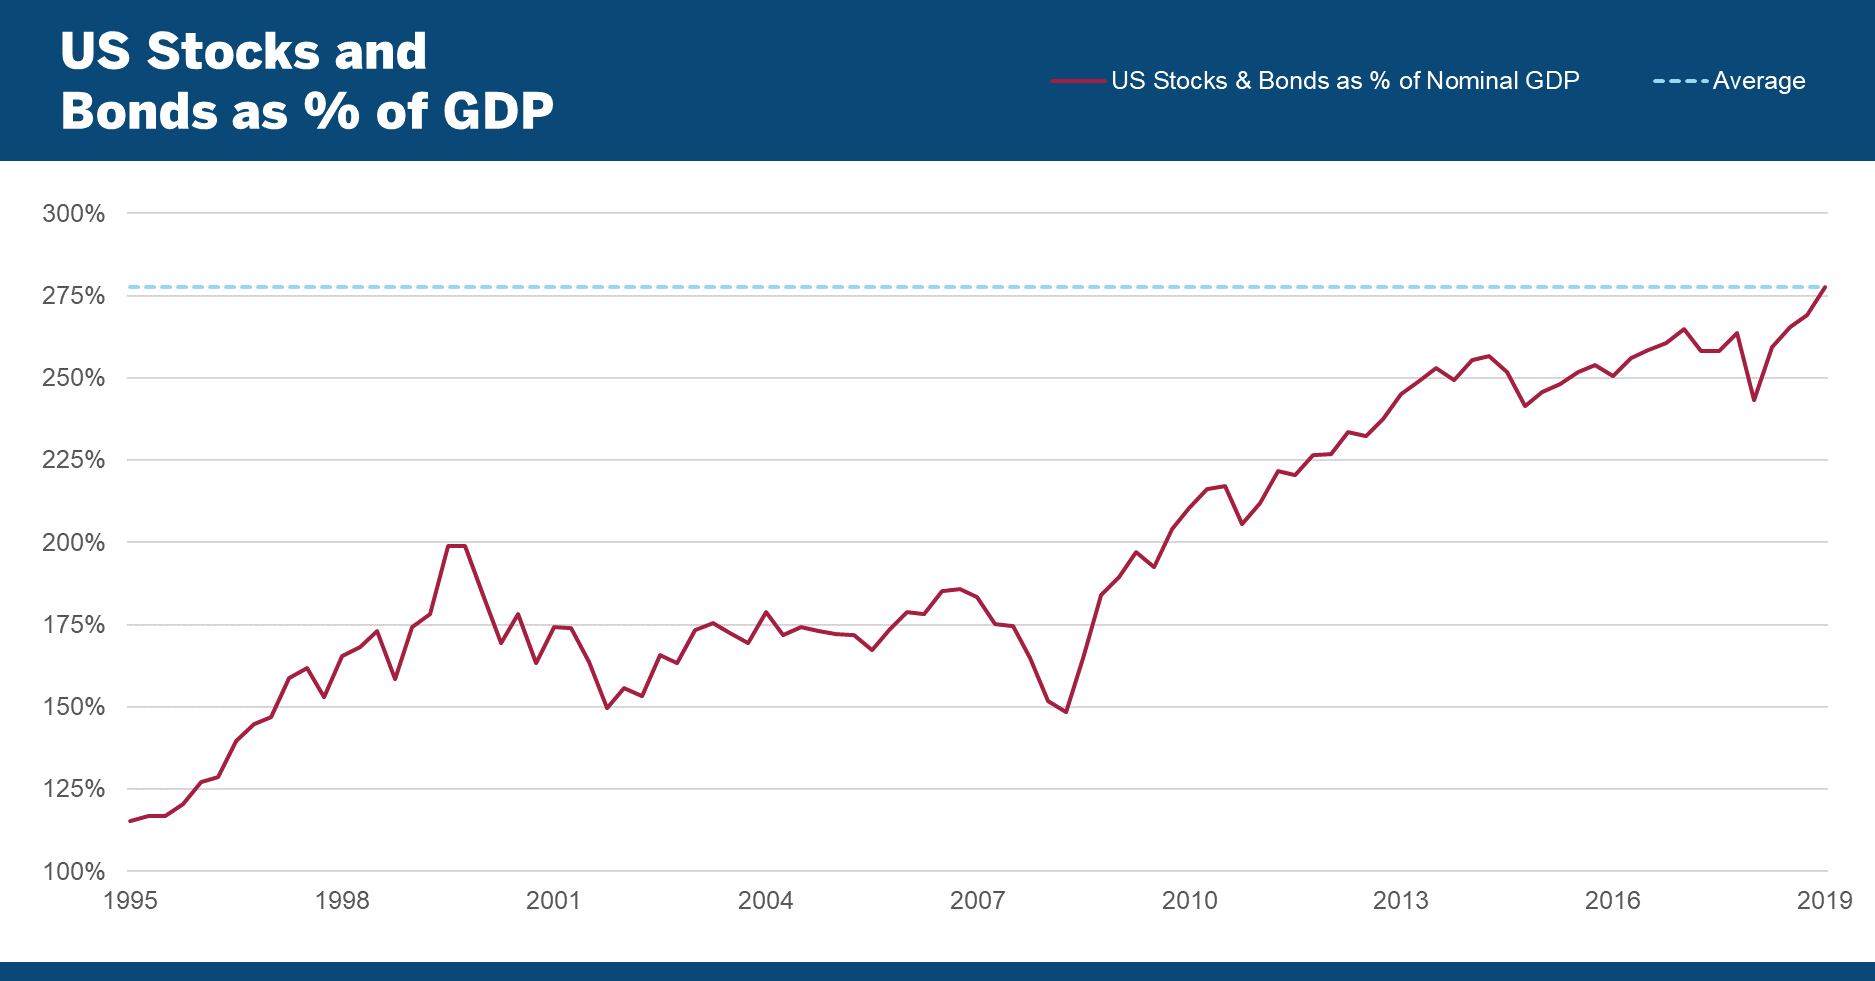
Worth noting is that in aggregate, the bond indexes were higher not only due to higher bond prices, but also because of increases in total face value represented, i.e., more debt issuance.
There’s no disputing that the value of U.S. stocks and bonds has grown at a much faster rate than U.S. GDP, especially after the financial crisis. How much longer it can continue, especially in the absence of any meaningful earnings growth, is up for debate.
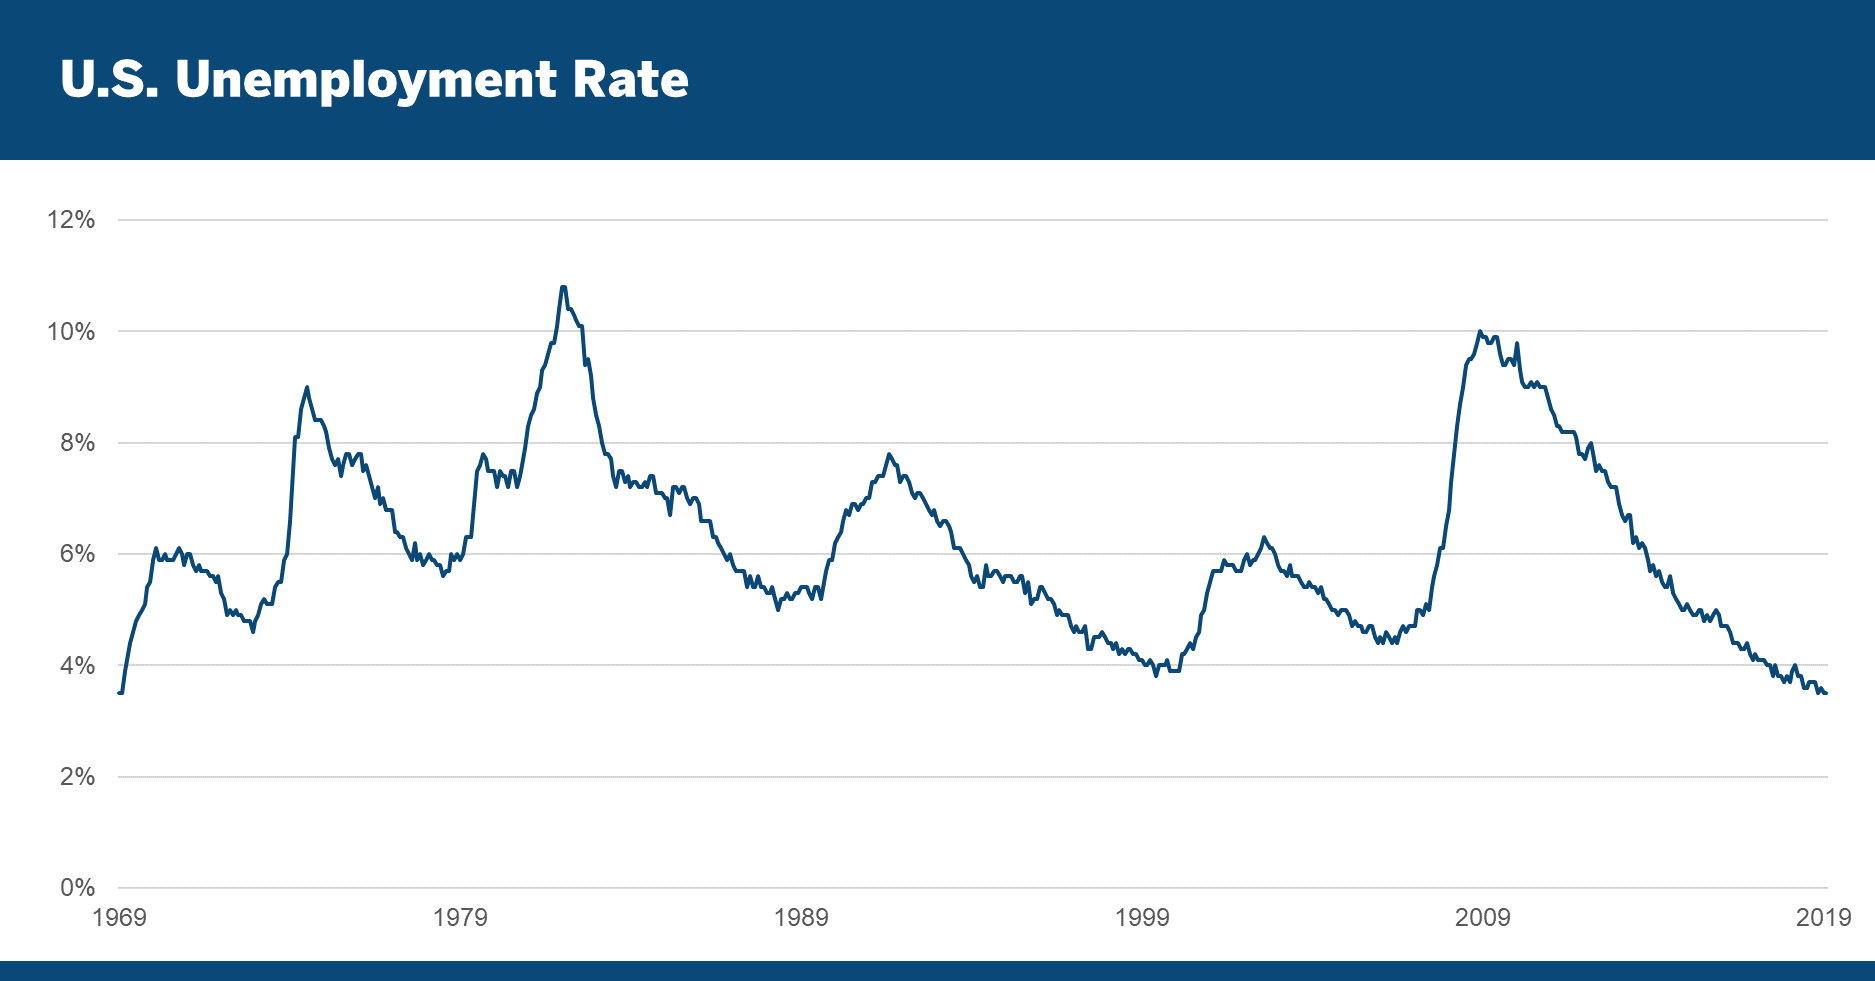
The most recent data show that unemployment fell 0.40% in 2019 to its lowest level in 50 years:
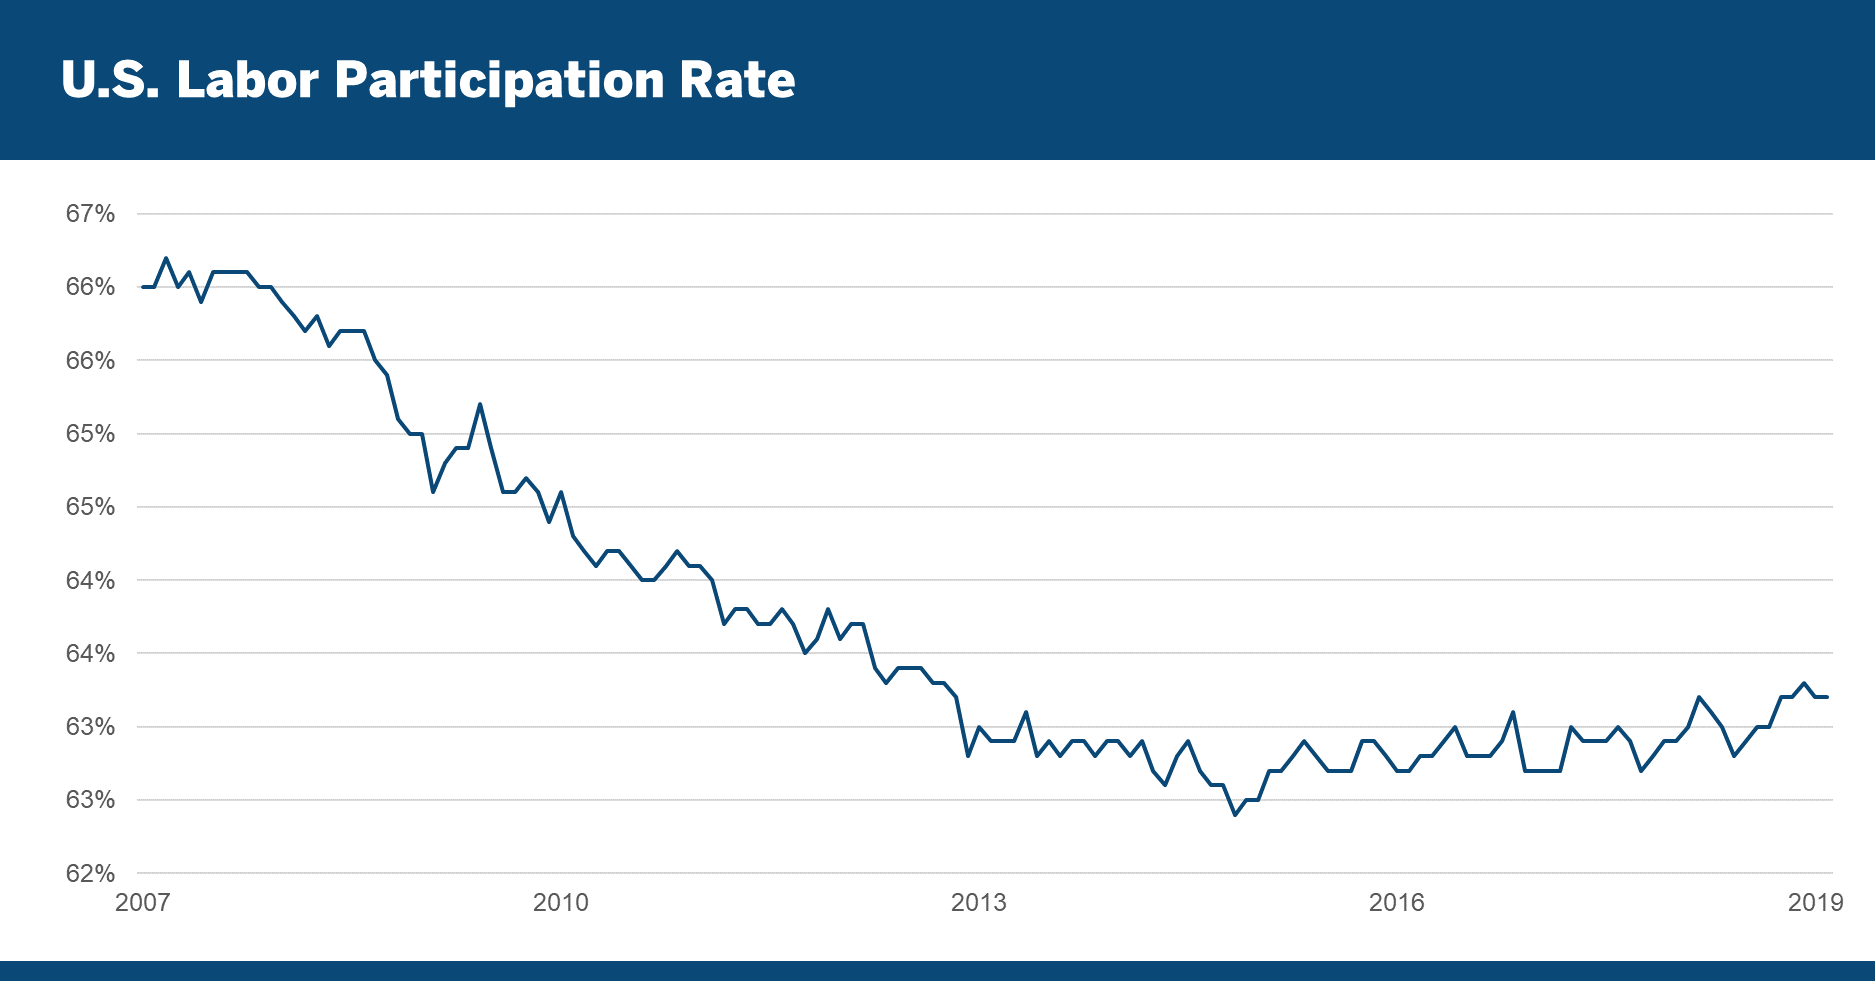
This low rate reflects not merely an increase in the working population, but a true decline in the number of unemployed workers:
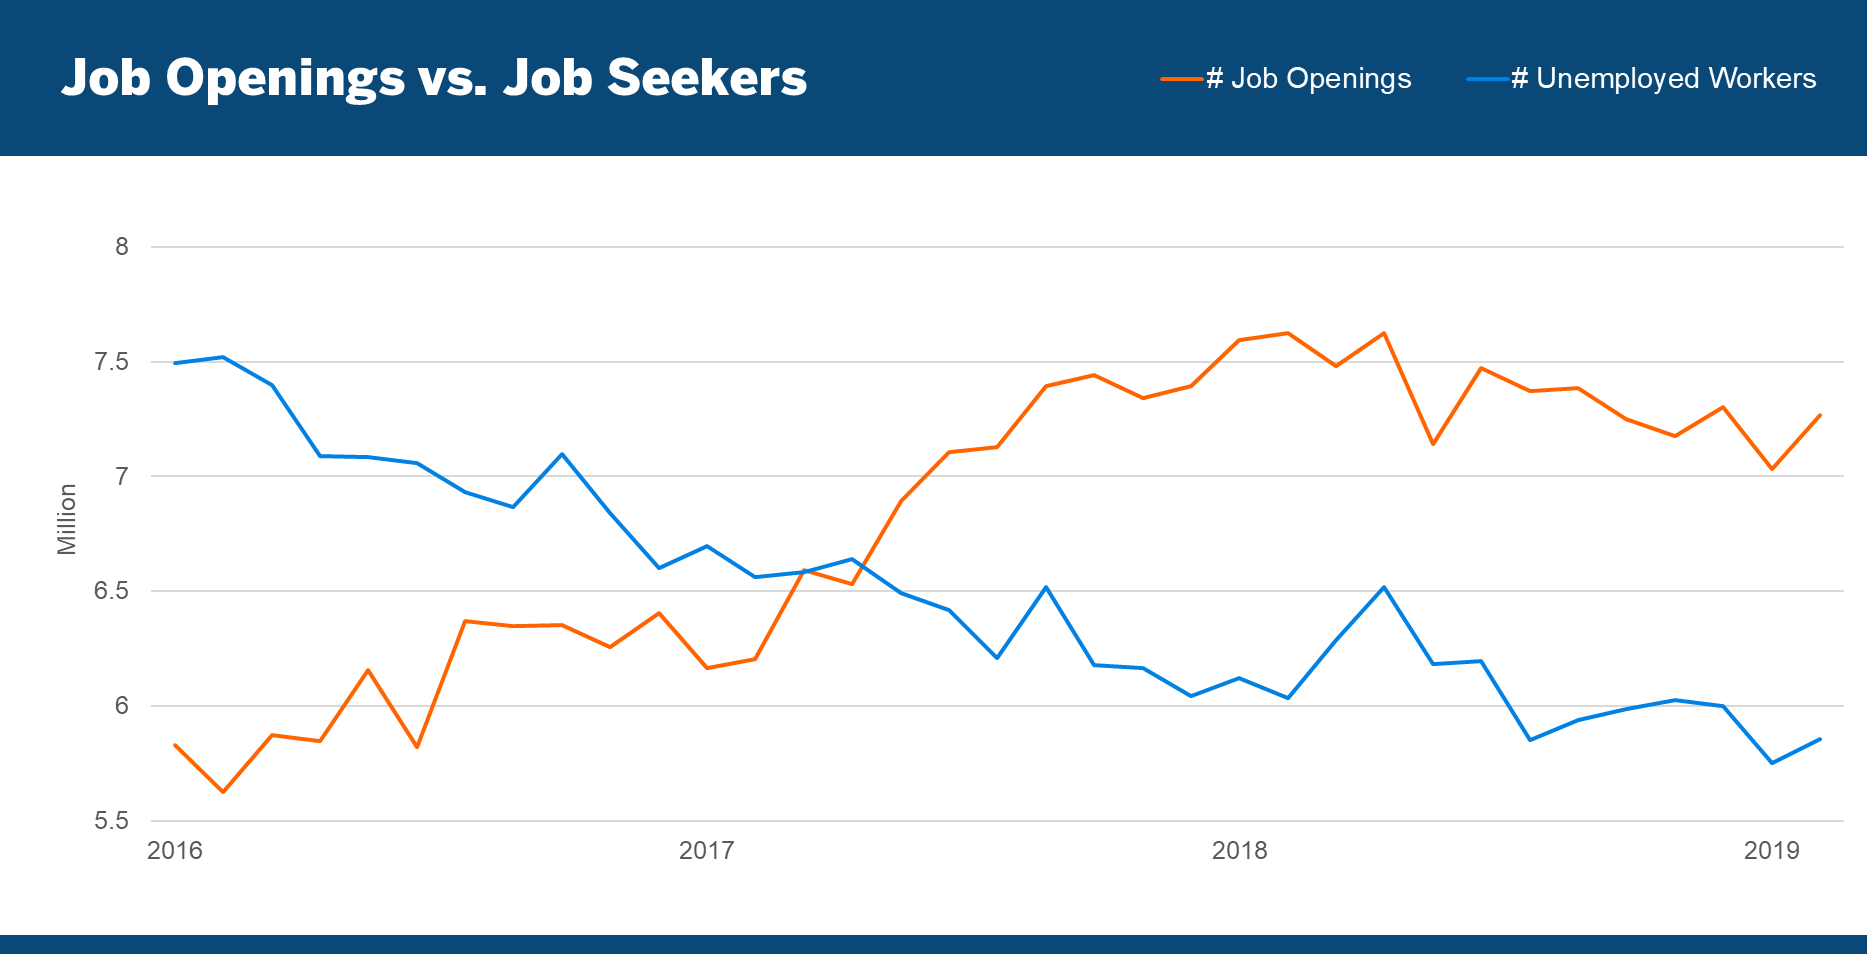
This low rate of unemployment is made all the more impressive given the upward trending labor participation rate of recent years. The magnitude by which the number of job openings exceeds the number of job seekers appears to be luring individuals back into the labor market:
Election 2020
Politics can’t get much more contentious than they are in the midst of an impeachment process, but that is nevertheless how our nation’s lawmakers finished off 2019. Fortunately for investors, financial markets seemed to attribute little significance to it.
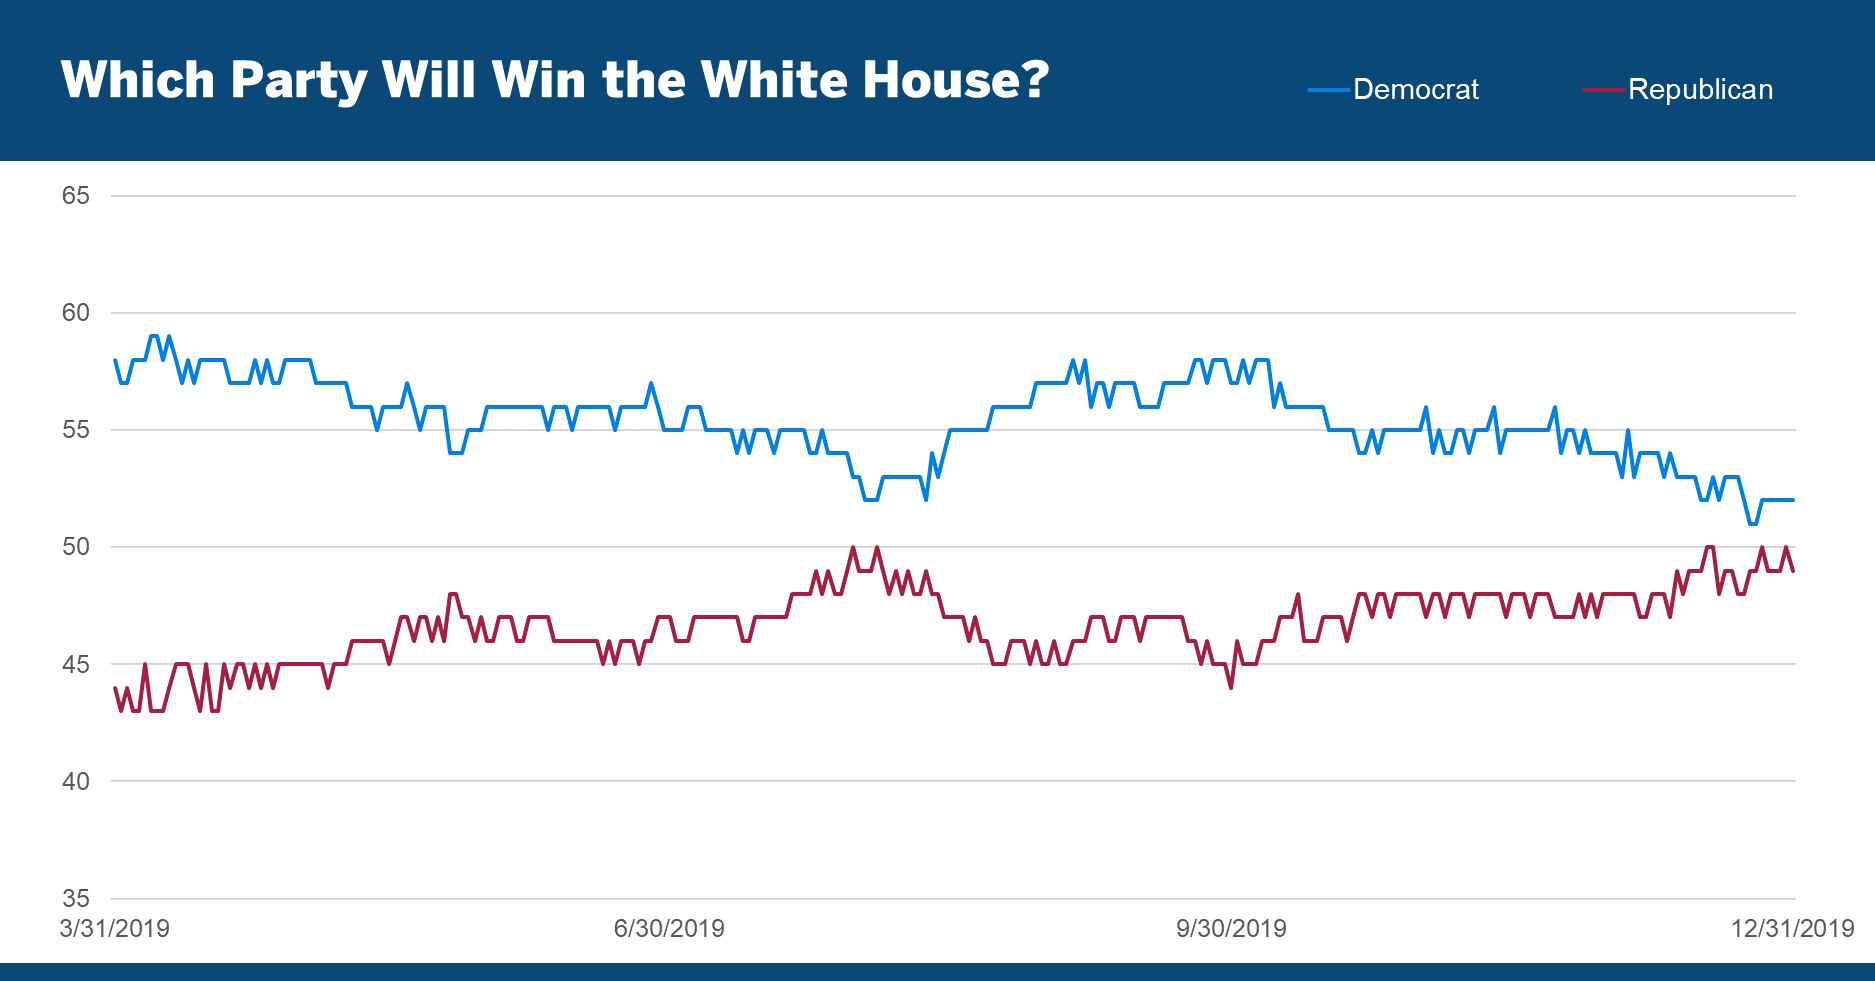
As the year came to a close, Predictit.org was indicating that odds of either party winning the White House in 2020 had narrowed to a near-even split:
In Congress, the predictions for control of the House and Senate seem to be made with greater confidence:
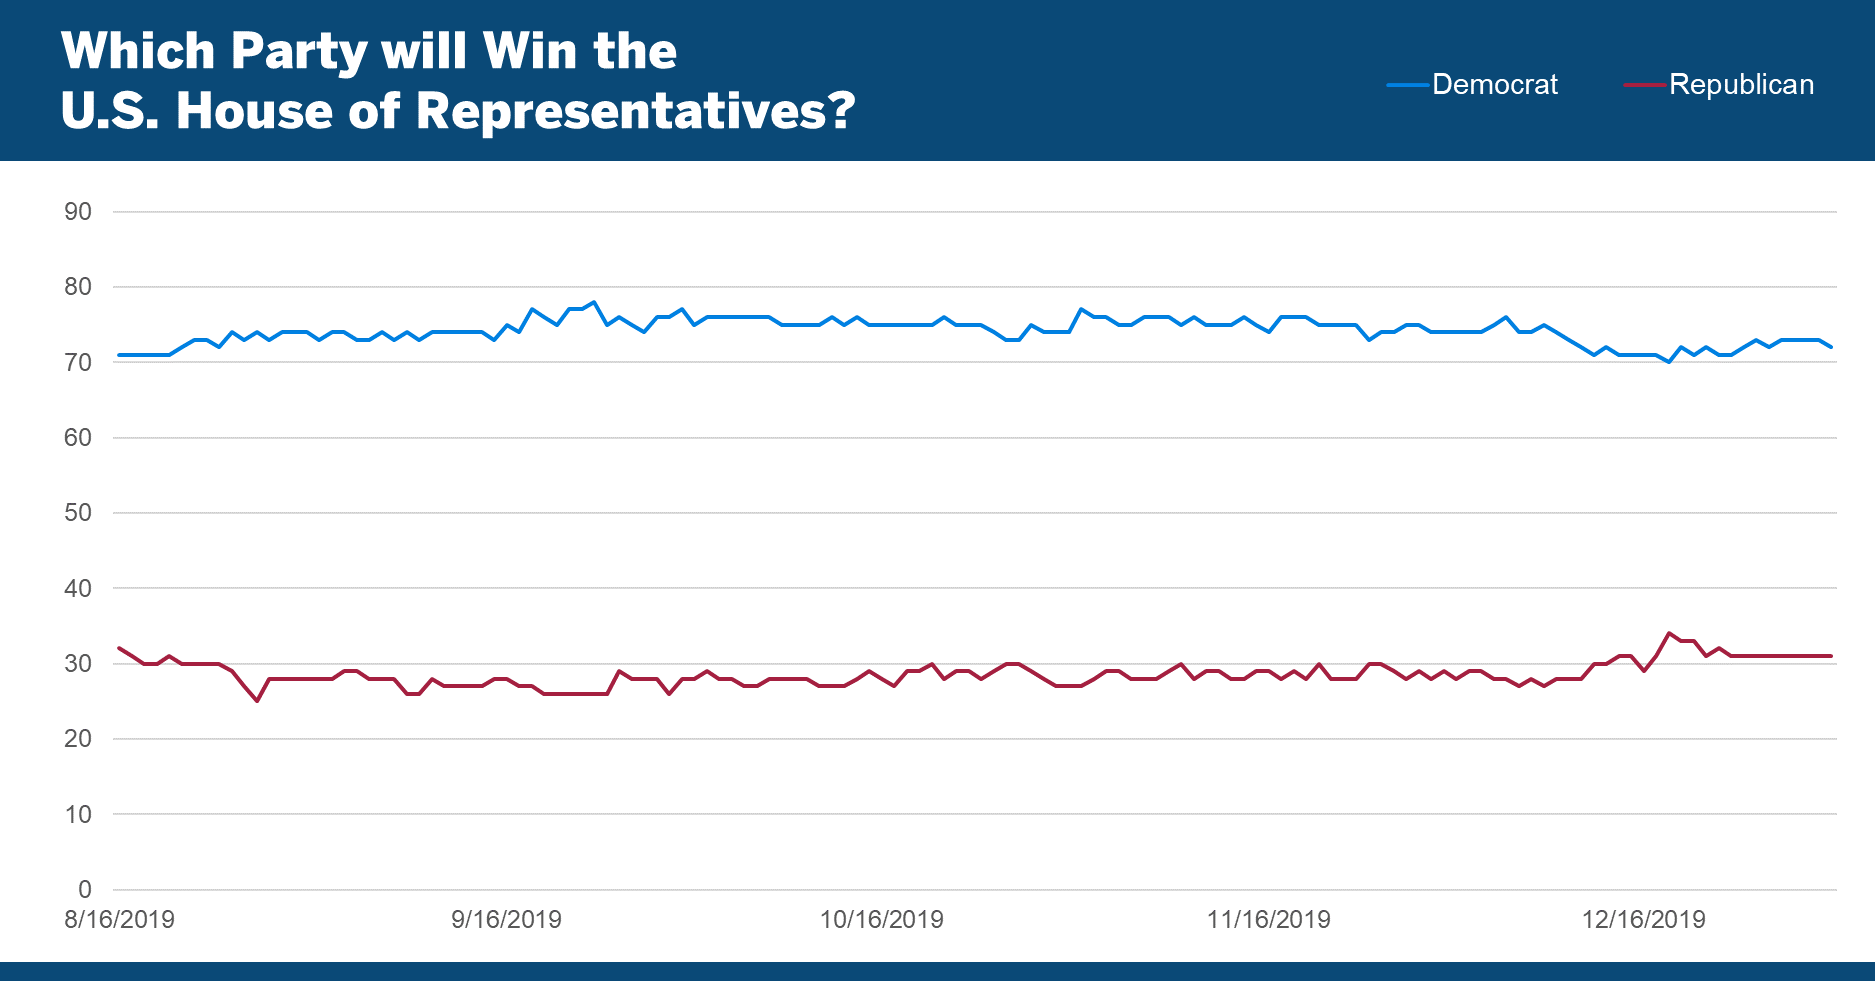
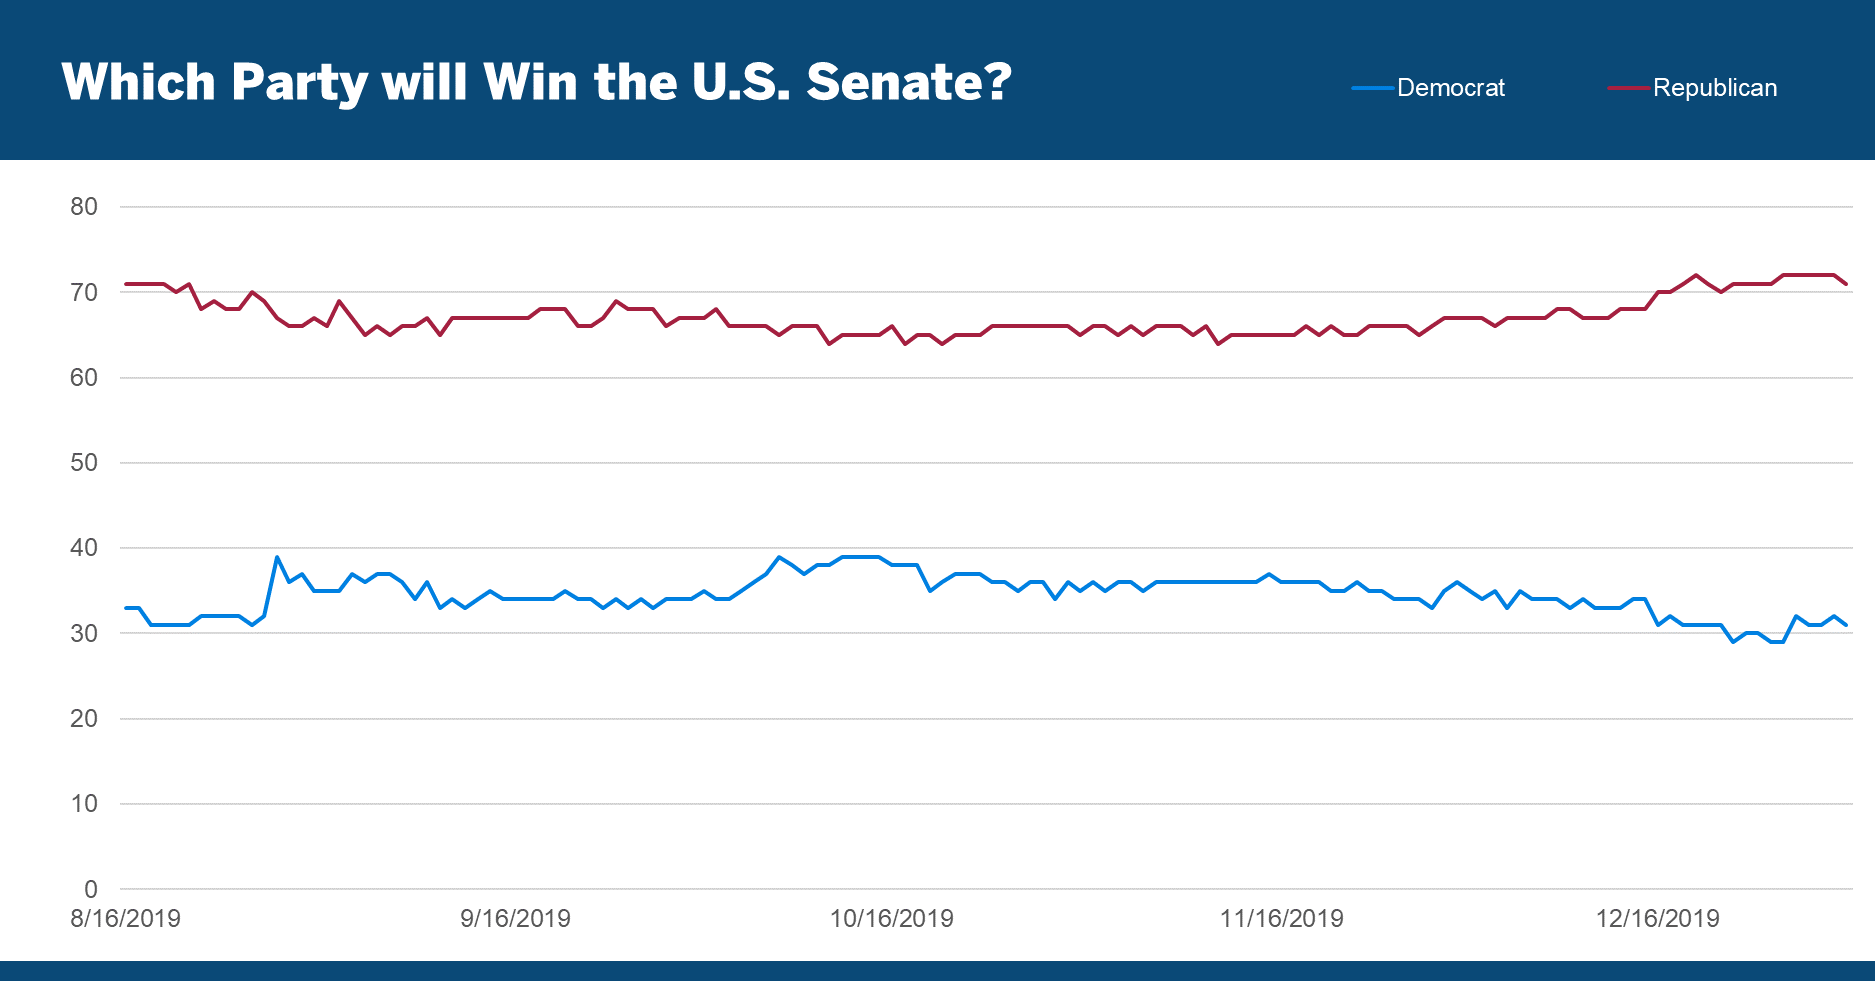
While national polls are one way to assess voters’ sentiment on political candidates, the numbers from PredictIt.org offer an interesting perspective in that they’re not based purely on asking a random sample of people who they’re likely to vote for. Rather, the numbers are based on the prices of shares that individuals can buy and sell. To be clear, the size and amount of participation in these markets make it perfectly reasonable to question their predictive power – the last election is a case in point. In the summer of 2016, they were indicating that candidate Trump had just a 30% chance of winning the November election. Still, given that the projections are based on individuals taking an unsolicited interest and using real money, the information these markets generate can offer some interesting insights.
Political Parties and Stock Market Returns
One question that often arises in the run-up to elections is how stock market returns are related to election outcomes, if at all. A look back to 1928 (the start date of the S&P 500’s index history) reveals a mixed bag. Since 1928 there have been 46 two-year terms. Over that period, Democrats have controlled both houses of Congress a majority of the time, while Republicans have held the White House just slightly less often than Democrats:
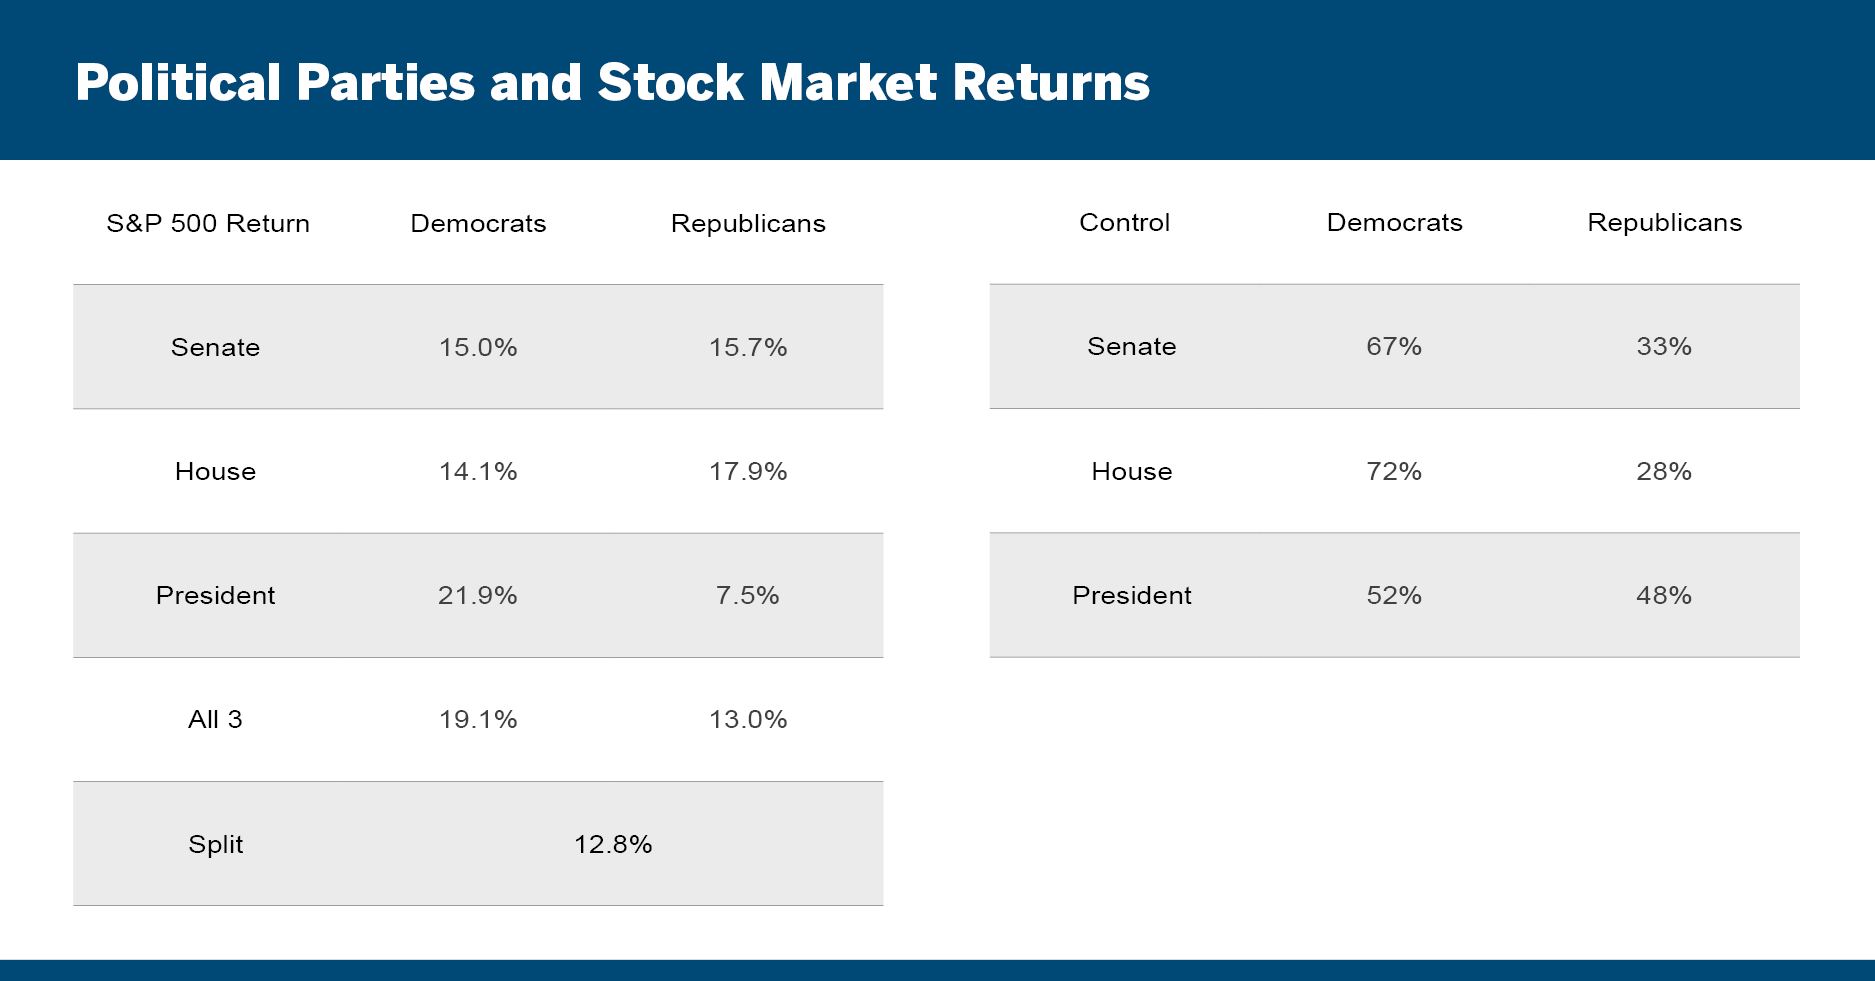
The S&P 500 has generated higher returns when Republicans have held the House and the Senate and when Democrats have held the Presidency. It’s worth noting that during the four-year depression-era presidency of Republican Herbert Hoover, during which the House and Senate were also under Republican control, the S&P 500 fell 92%. Absent his presidency, the average return under Republican presidents is much higher, although still well below that under Democrat presidents.
Interestingly, the returns of the S&P 500 have been higher when the White House and Congress were all controlled by the same party than when there was a split government. They were of course split in 2019 and the charts above suggest they will remain so after the November 2020 election.
Regardless of the election outcome, we believe investors will do well to moderate their 2020 return expectations, not merely on account of 2019’s strong risk-adjusted returns, but also because of the high valuations at which stocks are beginning the new year.
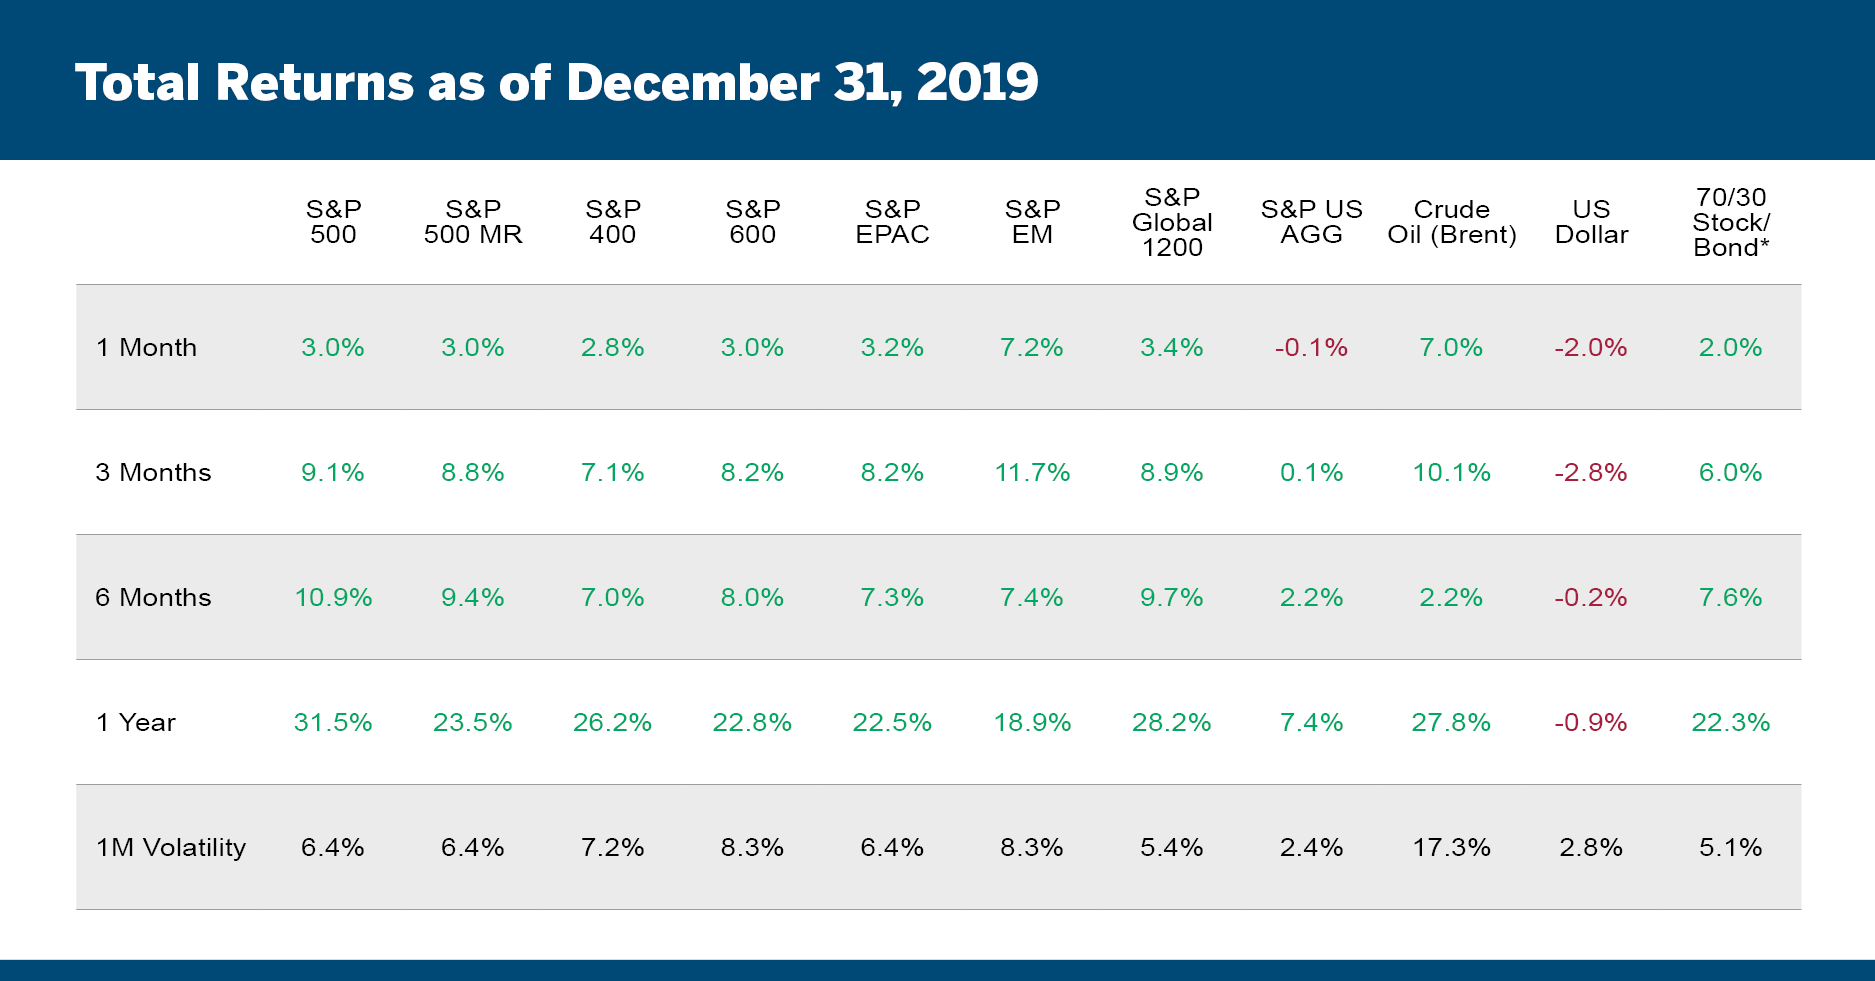
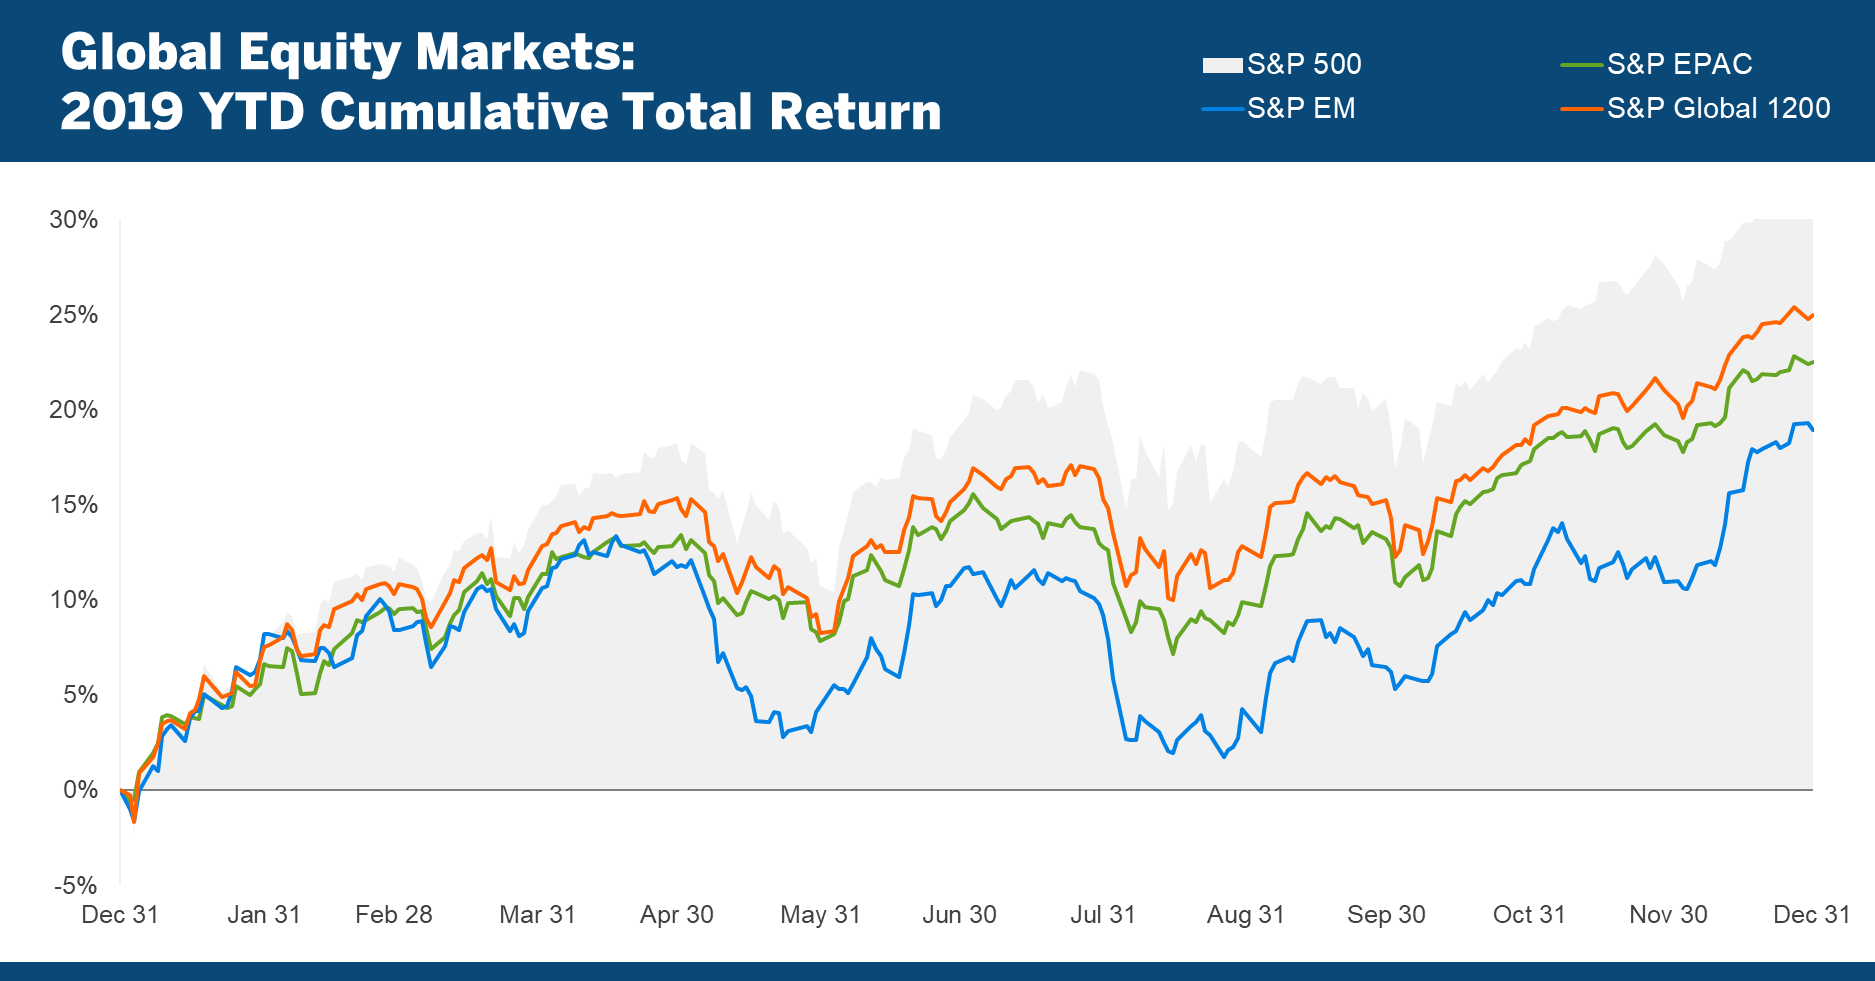
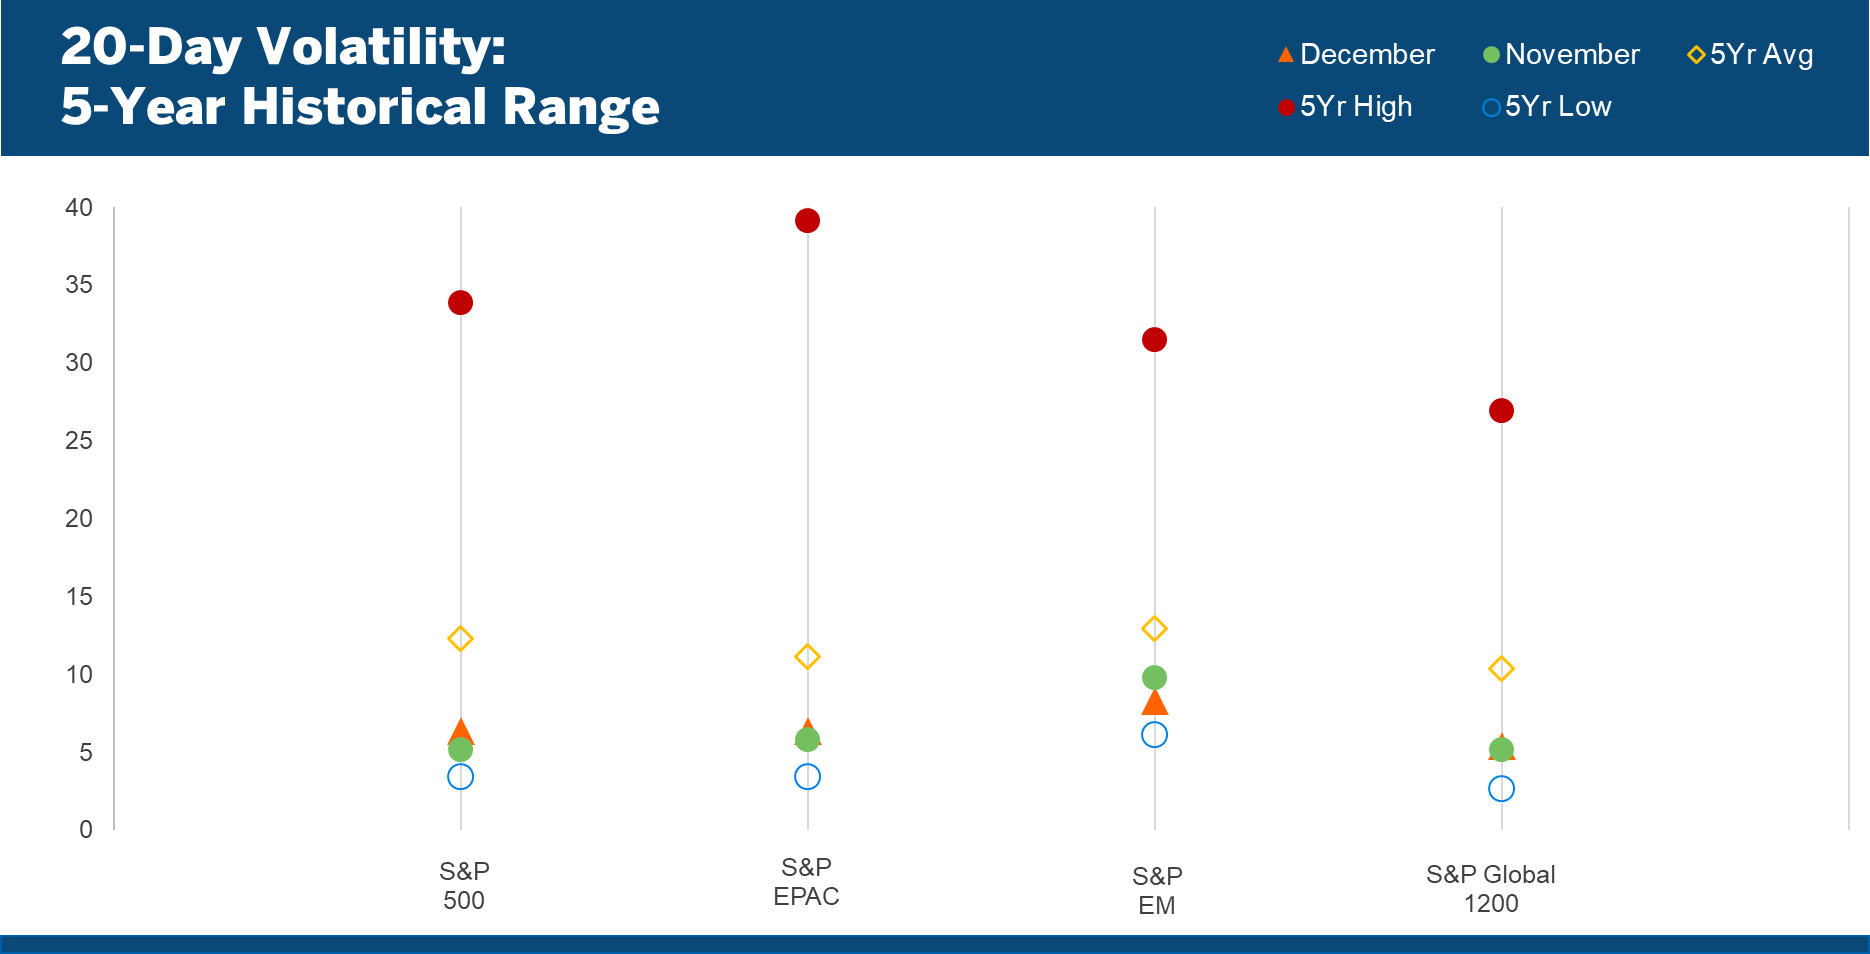
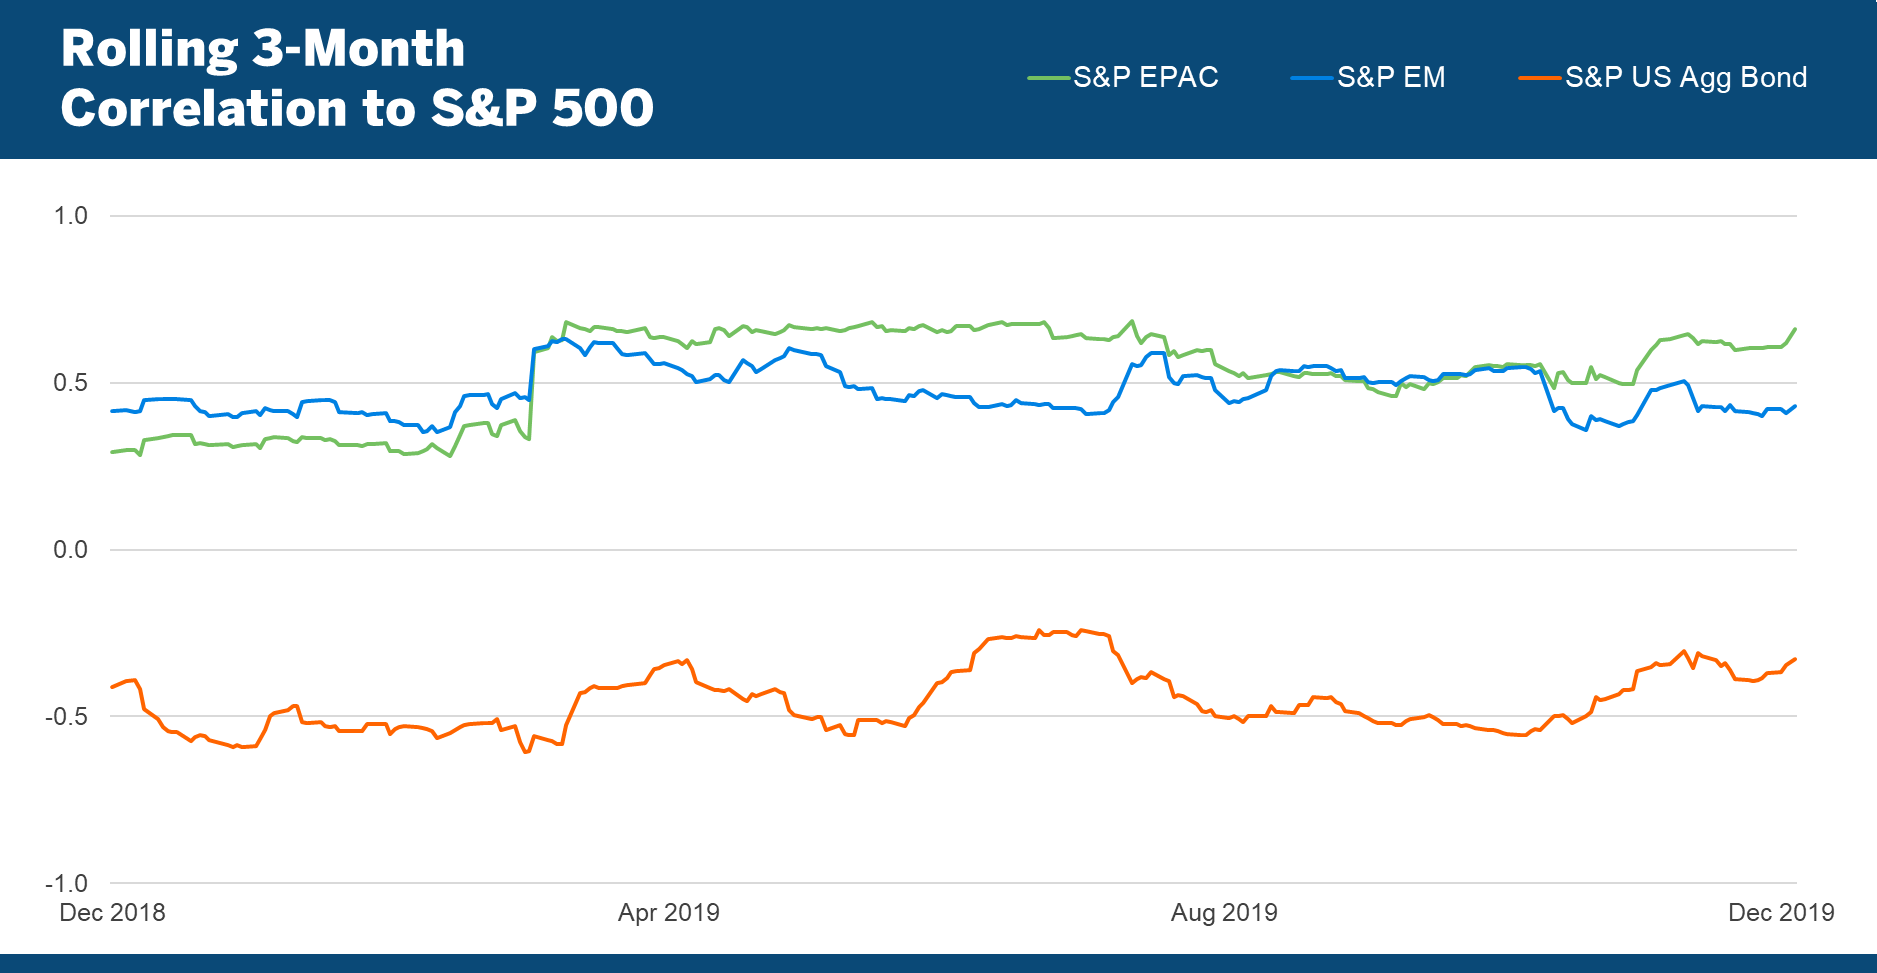
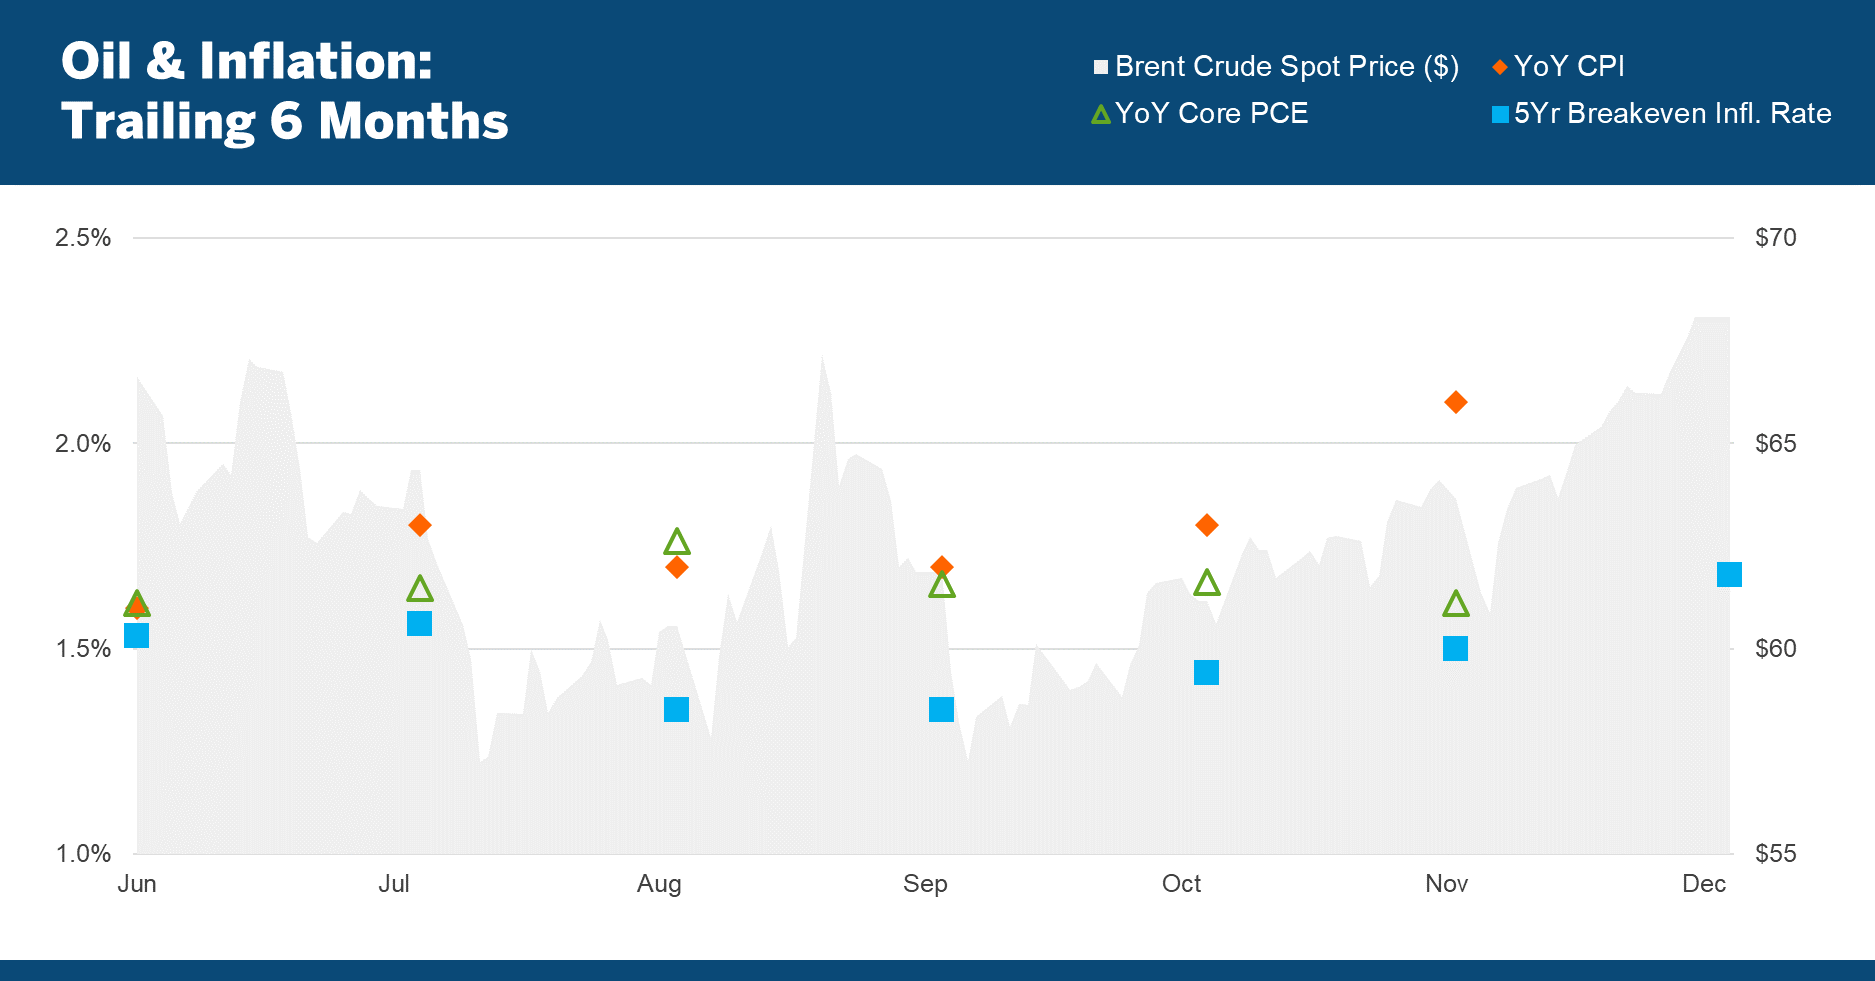
Market Snapshot
[1] Measured by the S&P 500 and S&P US Aggregate Bond Index
Unless otherwise noted, data is sourced from Bloomberg.
The information, products, or services described or referenced herein are intended to be for informational purposes only. This material is not intended to be a recommendation, offer, solicitation or advertisement to buy or sell any securities, securities related product or service, or investment strategy, nor is it intended to be to be relied upon as a forecast, research or investment advice.
The products or services described or referenced herein may not be suitable or appropriate for the recipient. Many of the products and services described or referenced herein involve significant risks, and the recipient should not make any decision or enter into any transaction unless the recipient has fully understood all such risks and has independently determined that such decisions or transactions are appropriate for the recipient. Investment involves risks. Any discussion of risks contained herein with respect to any product or service should not be considered to be a disclosure of all risks or a complete discussion of the risks involved.
The results shown are historical, for informational purposes only, not reflective of any investment, and do not guarantee future results. Any reference to a market index is included for illustrative purposes only, as it is not possible to directly invest in an index. Indices are unmanaged, hypothetical vehicles that serve as market indicators and do not account for the deduction of management fees or transaction costs generally associated with investable products, which otherwise have the effect of reducing the results of an actual investment portfolio.
The recipient should not construe any of the material contained herein as investment, hedging, trading, legal, regulatory, tax, accounting or other advice. The recipient should not act on any information in this document without consulting its investment, hedging, trading, legal, regulatory, tax, accounting and other advisors. Information herein has been obtained from sources we believe to be reliable but neither Milliman Financial Risk Management LLC (“Milliman FRM”) nor its parents, subsidiaries or affiliates warrant its completeness or accuracy. No responsibility can be accepted for errors of facts obtained from third parties.
The materials in this document represent the opinion of the authors at the time of authorship; they may change, and are not representative of the views of Milliman FRM or its parents, subsidiaries, or affiliates. Milliman FRM does not certify the information, nor does it guarantee the accuracy and completeness of such information. Use of such information is voluntary and should not be relied upon unless an independent review of its accuracy and completeness has been performed. Materials may not be reproduced without the express consent of Milliman FRM. Milliman Financial Risk Management LLC is an SEC-registered investment advisor and subsidiary of Milliman, Inc.
The S&P Managed Risk Index Series is generated and published under agreements between S&P Dow Jones Indices and Milliman Financial Risk Management LLC.